AUD/NZD Price Analysis: Hovers inside ascending triangle around 1.0950 ahead of RBA
- AUD/NZD renews intraday low while staying inside a bearish chart formation.
- Mostly steady RSI, sustained trading above the key SMAs challenge sellers.
- RBA is expected to increase benchmark rate for the first time in over a decade.
AUD/NZD struggles to extend recent upside momentum, consolidating gains around 1.0950 during Tuesday’s Asian session.
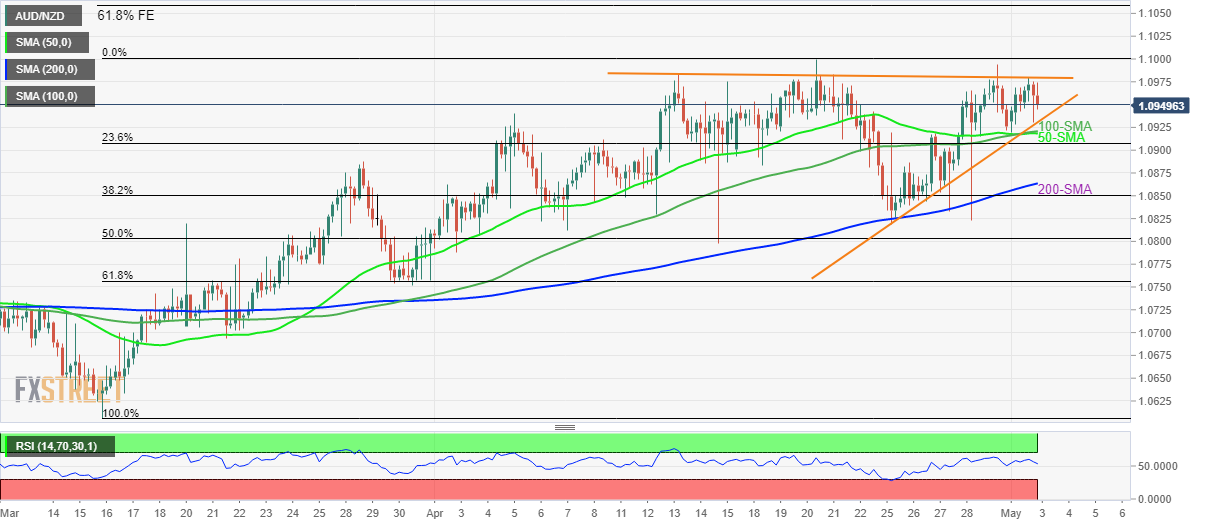
In doing so, the cross-currency pair remains inside a three-week-old ascending triangle bearish chart pattern ahead of the Reserve Bank of Australia (RBA) monetary policy meeting.
The RBA meeting becomes more important this time as the Aussie central bank is up for a 0.15% rate hike, it's first since November 2010. The same should help the AUD/NZD prices in case matching the market consensus. However, the Australian policymakers have been behind their global friends, as far as central bank moves are concerned, which in turn may trigger a major pullback in case of disappointment.
Read: Reserve Bank of Australia Preview: Will a 15 bps rate hike be enough to lift the aussie?
That said, a convergence of the 50-SMA and the 100-SMA adds strength to the immediate downside filter around 1.0925-20, a break of which will confirm the bearish formation.
As a result, the 200-SMA and 61.8% Fibonacci retracement (Fibo.) of March-April moves, near 1.0755 will gain the market’s attention in that case.
Alternatively, an upside clearance of the 1.0985 will defy the triangle pattern and can propel the AUD/NZD prices towards the 61.8% Fibonacci Expansion of the mid-March to late April moves, near 1.1055.
AUD/NZD: Four-hour chart
Trend: Further upside expected