EUR/JPY Price Analysis: Retreats around 137.60 daily highs, below 137.00 as a head-and-shoulders formed
- The EUR/JPY begins May with modest losses of 0.09%.
- A dismal market sentiment, increased appetite for safe-haven peers.
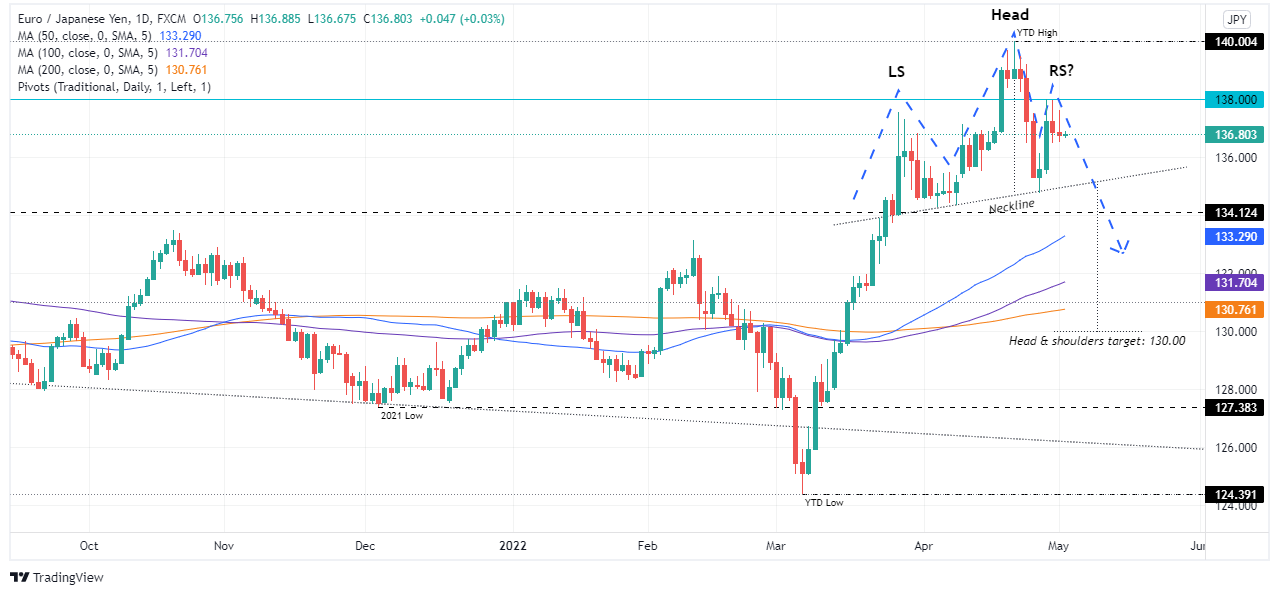
- EUR/JPY Price Forecast: From a daily chart perspective, a head-and-shoulders pattern has formed and, once validated, might drag the EUR/JPY towards 130.00.
The EUR/JPY records minimal gains as Tuesday’s Asian Pacific session begins, amidst a mixed market mood, as Asian equity futures gain, except for the Australian S&P/ASX 200. At the time of writing, the EUR/JPY is trading at 136.80 and record gains of 0.04%.
The market sentiment is mixed but tilted upbeat, as Asian futures carried on New York sentiment. In the FX space, the gainer was the greenback, while the euro remained defensive as the EUR/USD hovered around 1.0500. That bolstered the JPY vs. the EUR, recording gains of 0.09%, though diminute, are still gains. Meanwhile, concerns about China’s coronavirus outbreak which threatens to disrupt the supply side, while the Russia-Ukraine tussles continued, weighed some in the risk appetite.
During the overnight session, the EUR/JPY opened around 136.88 and meandered around the 50-hour simple moving average (SMA), almost horizontal, around 137.07. However, once European traders got off their desks, the US session’s sour sentiment weighed on the EUR/JPY, dragging the pair towards new daily lows around 136.60. Nonetheless, a late improvement in market mood in the New York session lifted the cross-currency pair towards 136.80.
EUR/JPY Price Forecast: Technical outlook
The EUR/JPY daily chart depicts the pair as upward biased, though it in the last couple of days was unable to break resistance at 138.00, courtesy of EUR weakness. Also, a head-and-shoulders pattern is forming, which would add downward pressure on the pair, though a break below the neckline is needed to validate the pattern.
If that scenario plays out, the EUR/JPY first support would be 136.00. Break below would drag the pair towards the head-and-shoulders necklines, around 134.70-135.00. Once broken, the next stop would be last year’s high, around 134.12, followed by some DMAs before reaching the 130.00 head-and-shoulders targets.