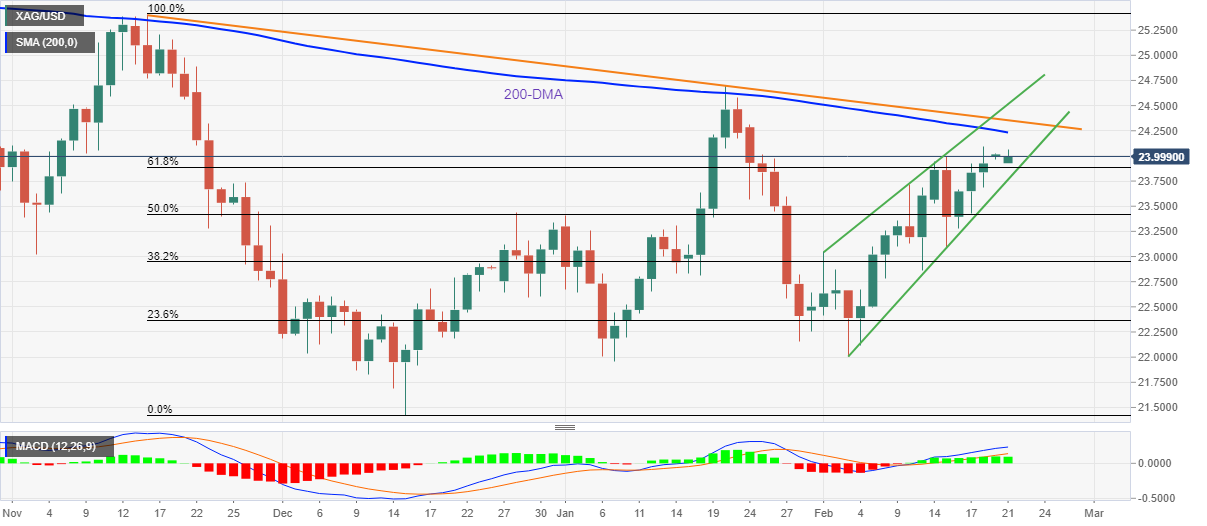
Silver Price Analysis: XAG/USD seesaws near $24.00 inside monthly rising wedge
- Silver grinds higher around one-month high, stays inside bearish chart pattern.
- 200-DMA, 14-week-old resistance line challenge immediate upside, bullish MACD favor buyers.
- Bears need validation from $23.70 while 50% Fibonacci retracement acts as another strong support.
After rising for three consecutive weeks, silver (XAG/USD) prices remain on the front foot around $24.00 during Monday’s Asian session.
In doing so, the bright metal pokes the highest levels last seen on January 24 while taking rounds to 61.8% Fibonacci retracement of November-December 2021 downside.
It should be noted, however, that the bullish MACD signals keep silver buyers hopeful to refresh monthly top.
That said, the 200-DMA and a descending trend line from late November, respectively around $24.25 and $24.35, become tough nuts to crack for the XAG/USD bulls.
Following that, the upper line of a three-week-old rising wedge bearish chart pattern and January’s peak, near $24.50 and $24.70 in that order, will challenge the commodity buyers.
Alternatively, a clear downside break of the 61.8% Fibo. level near $23.90 will attack the wedge’s lower line, near $23.70 at the latest.
Also acting as the key support is the $23.40 level comprising highs marked during late December and early January, as well as 50% Fibonacci retracement.
Should the silver bears manage to keep reins past $23.40, the 2022 bottom surrounding $21.95 will be in focus.
Silver: Daily chart

Trend: Pullback expected
