Gold Price Forecast: XAU/USD loses traction before testing $1,800
- Gold erased majority of daily gains in early American session.
- Renewed USD strength is limiting XAU/USD's upside on Tuesday.
- Key resistance for gold seems to have formed near $1,800.
The XAU/USD pair closed the fourth straight day in the negative territory and preserved its bullish momentum during the first half of the day on Tuesday. After reaching its highest level in 10 days at $1,795, however, gold lost its traction and was last seen posting small daily gains at $1,790.
The risk-averse market environment at the start of the week helped XAU/USD gather bullish momentum. Nevertheless, the greenback also capitalized on safe-haven flows and didn't allow the pair to push higher in the early American session.
Reflecting the dismal market mood, the S&P Futures and the Nasdaq Futures indexes are down 0.43% and 0.52%, respectively. Meanwhile, the US Dollar Index is rising 0.31% on the day at 92.90. In case Wall Street's main indexes suffer heavy losses after the opening bell, the USD could continue to outperform its rivals and force XAU/USD to extend its downward correction.
The data published by the US Census Bureau showed on Tuesday that Retail Sales declined by 1.1% on a monthly basis in July to $617.7 billion. This reading came in worse than the market expectation for a decrease of 0.2% and revived concerns over the coronavirus Delta variant crippling the economic recovery.
On Wednesday, the FOMC will release the minutes of its July policy meeting and investors will look for clues regarding the timing of asset tapering.
Gold technical outlook
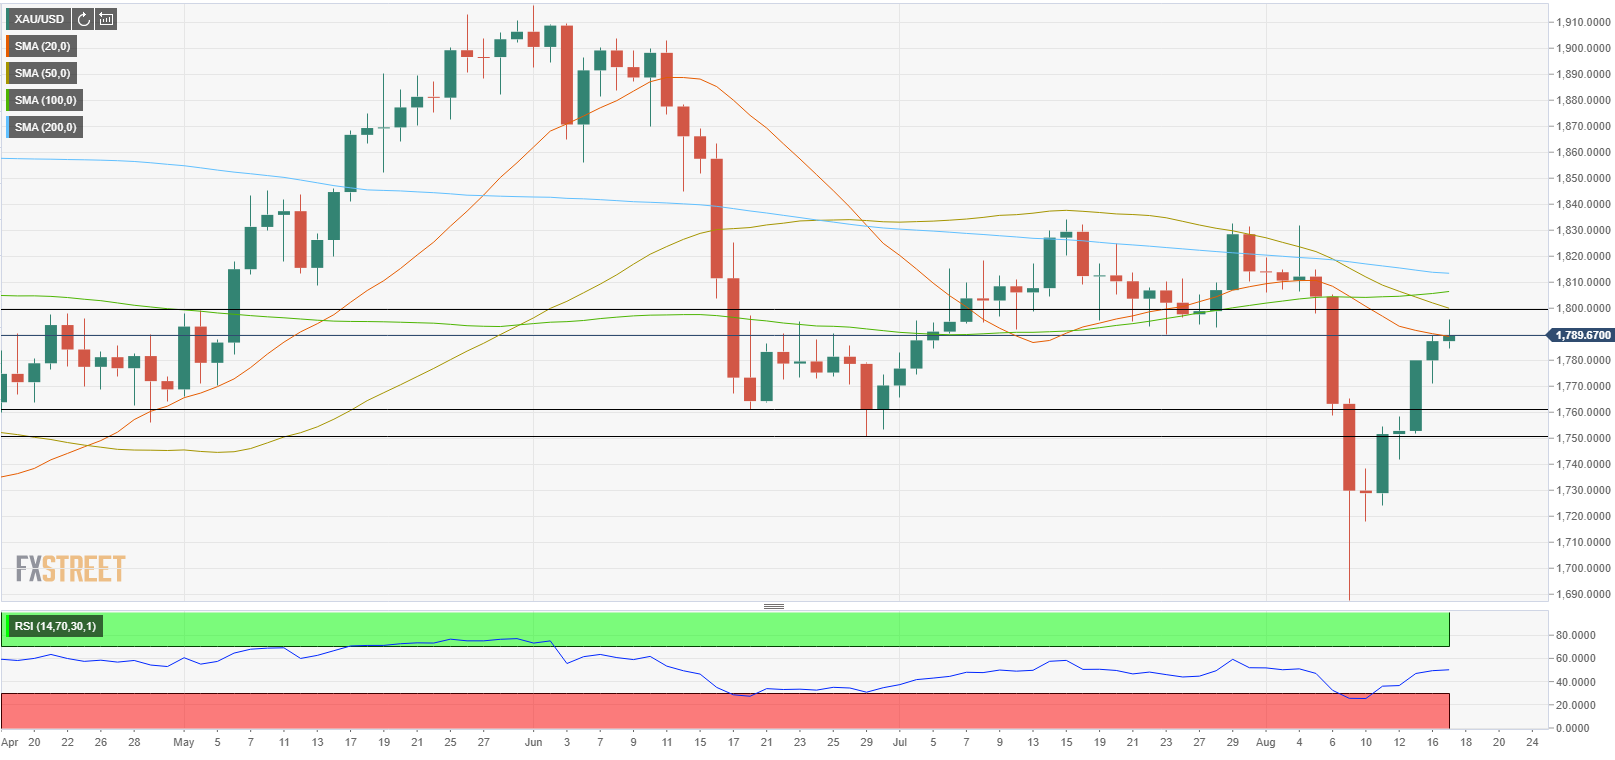
Key resistance for gold seems to have formed at $1,800 (psychological level, 50-day SMA). In case buyers manage to carry the price beyond that level and confirm it as support, the next target on the upside could be seen at $1,807 (100-day SMA) and $1,815 (200-day SMA).
In the meantime, the Relative Strength Index (RSI) indicator on the daily chart is moving sideways near 50, suggesting that the pair could have a difficult time clearing $1,800 unless it's supported by a fundamental driver.
On the flip side, the 20-day SMA at $1,790 is the first technical support. With a daily close below that level, gold could edge lower toward 1,760 (static level) and $1,750 (static level, June 29 low).
Additional levels to watch for