GBP/USD Price Analysis: Extends bounce off 200-HMA towards 1.3700
- GBP/USD picks up bids to keep the bulls hopeful above the short-term key moving average.
- Bullish MACD signals also back the odds to witness fresh high since May 2018.
- Monthly low holds the key to bears’ entry.
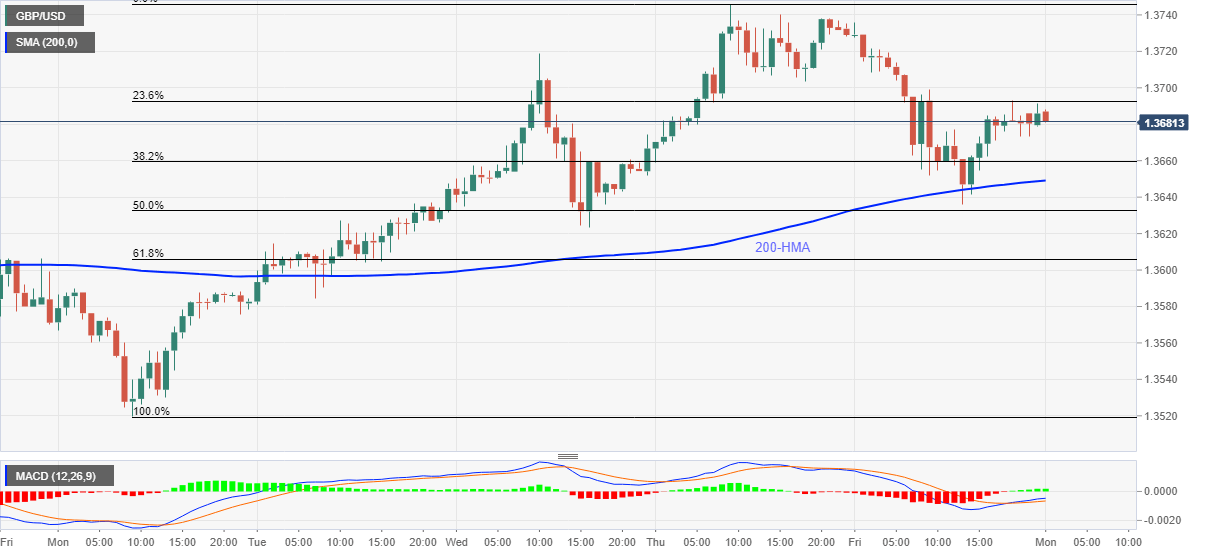
GBP/USD rises to 1.3688, up 0.06% intraday, during Monday’s Asian session. In doing so, the cable keeps Friday’s U-turn from 200-hour moving average (HMA) amid the bullish MACD.
With this, GBP/USD is up for breaking the 1.3700 immediate hurdle whereas Thursday’s high, also the highest since May 2018, around 1.3750, will lure the buyers afterward.
During the quote’s sustained rise past-1.3750, April 2018 low near 1.3965 will be the key for GBP/USD bulls.
On the flip side, a clear break below 200-HMA, at 1.3650 now, needs validation from 61.8% Fibonacci retracement of January 18-21 upside, near 1.3600, to recall GBP/USD sellers.
Following that, 1.3520 and the monthly low near 1.3450 should gain the market’s attention.
Overall, GBP/USD is an uptrend towards the early 2018 highs and the latest bounce off the key moving average strengthens the upside expectations.
GBP/USD hourly chart
Trend; Bullish