NZD/USD Price Analysis: Off weekly triangle resistance to reprint 0.6550
- NZD/USD takes a U-turn from the weekly high near 0.6565.
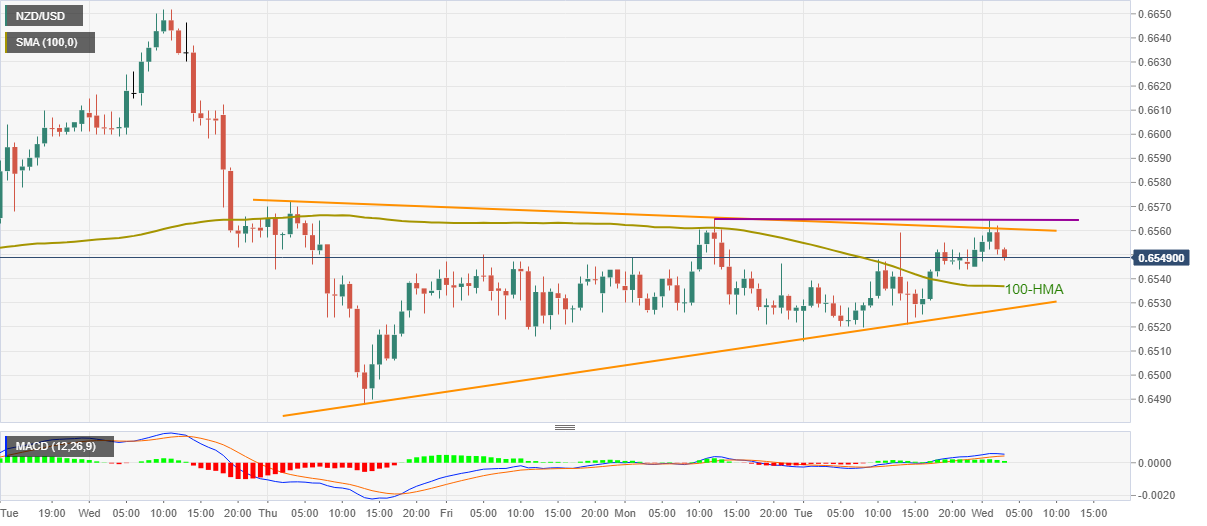
- 100-HMA offers immediate support inside the symmetrical triangle.
- A two-day-old horizontal resistance adds to the upside barrier.
Following the second failure to cross 0.6565, NZD/USD drops to 0.6550 amid the initial trading on Wednesday. In doing so, the pair also respects a symmetrical triangle comprising levels marked since last Thursday.
As a result, the quote is expected to continue its latest weakness towards revisiting the 100-HMA level of 0.6535. However, the mentioned triangle’s support around 0.6525 will challenge the sellers afterward.
If the pair fails to bounce off 0.6525, the monthly low near 0.6488 will return to the chart.
Meanwhile, the upper line of the triangle near 0.6560 precedes the 0.6565 immediate resistance signifying the “double top” formation.
During the pair’s upside past-0.6565, the 0.6600 threshold and a monthly falling trend line near 0.6630 will be important to watch.
NZD/USD hourly chart
Trend: Further weakness expected