Back
29 Jul 2020
Gold Price Analysis: Stuck in a broadening channel on the 5-min chart
- Gold lacks clear directional bias with prices stuck in an expanding sideways channel.
- A breakout would open the doors for re-test of record highs.
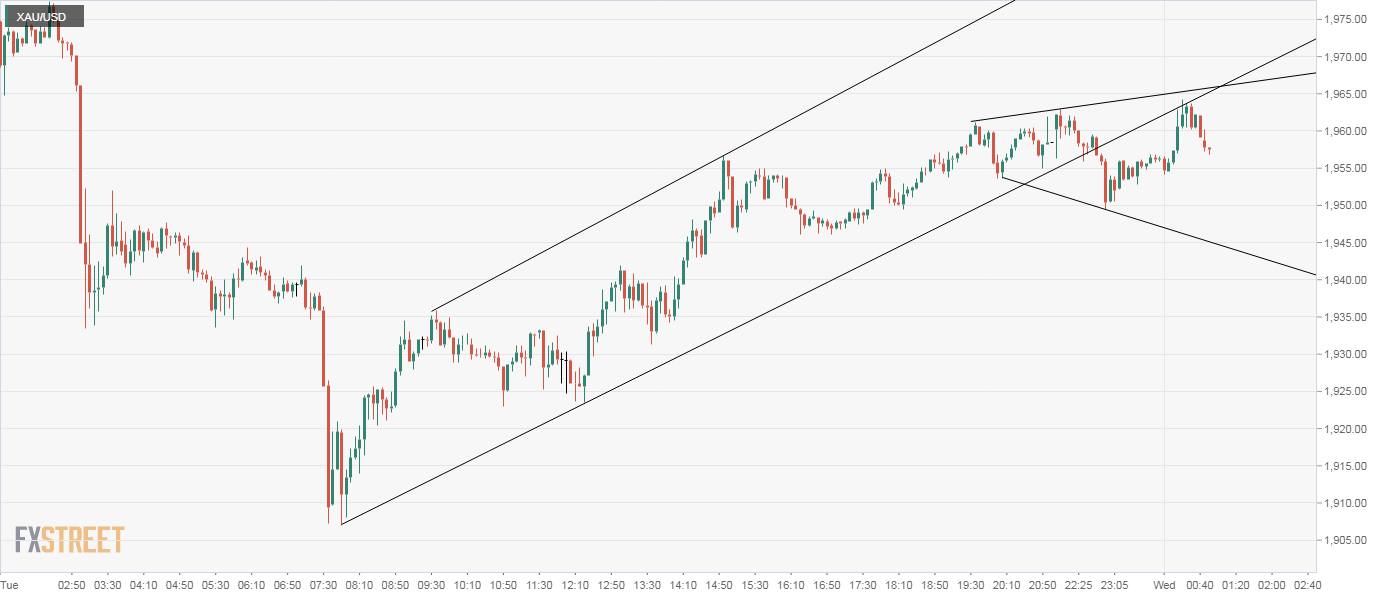
Gold has carved out a broadening sideways channel on the 5-minute chart. At press time, the yellow metal is trading largely unchanged on the day near $1,957 per ounce.
A break below the lower end or support of the broadening channel, currently at $1,945, would validate the ascending channel breakdown witnessed during the overnight trade and shift risk in favor fo a drop to lows below $1,910 observed on Tuesday.
Alternatively, a move above the channel hurdle at $1,966 would imply a resumption of the rally from lows below $1,910 and open the doors to re-test of the record high of $1,981.20 reached during Tuesday's Asian trading hours.
5-minute chart
Trend: Bullish above $1,966
Technical levels