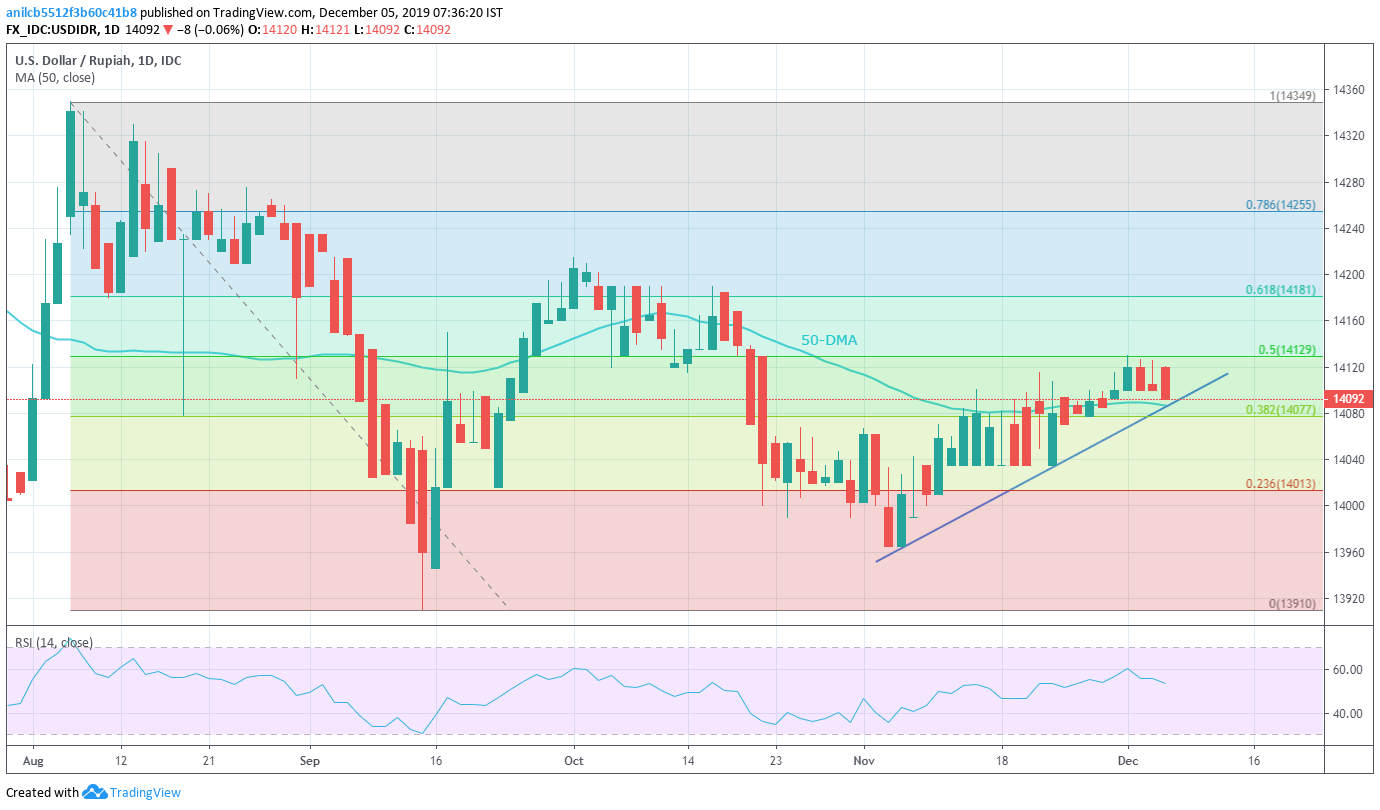
USD/IDR Technical Analysis: Sellers look for entry below monthly trendline, 50-DMA
- USD/IDR registers the third day of declines.
- Mid-November lows will be on bear’s radar during further declines.
- Buyers will wait unless clearing 50% Fibonacci retracement of August-September fall.
USD/IDR drops to 14,090 by the press time of early Thursday in Asia. The pair is on the third day of losing streak but stays above near-term key support confluence.
Unless providing a clear break below 14,087/85 area including a month-long rising support line and 50-Day Simple Moving Average (DMA), prices can keep the monthly upward trajectory that leads to 50% Fibonacci retracement level of 14,130.
It’s worth mentioning that 61.8% Fibonacci retracement near 14,180 and October top close to 14,215 will be the Bull’s favorite during pair’s rise past-14,130.
On the contrary, a daily closing below 14,085 could drag prices to multiple lows marked in mid-November around 14,030 ahead of shifting focus to 14,000 round-figure.
Further, the November month low near 13,965 and September bottom close to 13,910 could lure bears afterward.
USD/IDR daily chart

Trend: Pullback expected
