Back
3 Dec 2019
EUR/USD Technical Analysis: Euro remains bid, approaching 1.1093 resistance
- EUR/USD is consolidating the recent gains made on Monday.
- The level to beat for bulls is the 1.1093 resistance.
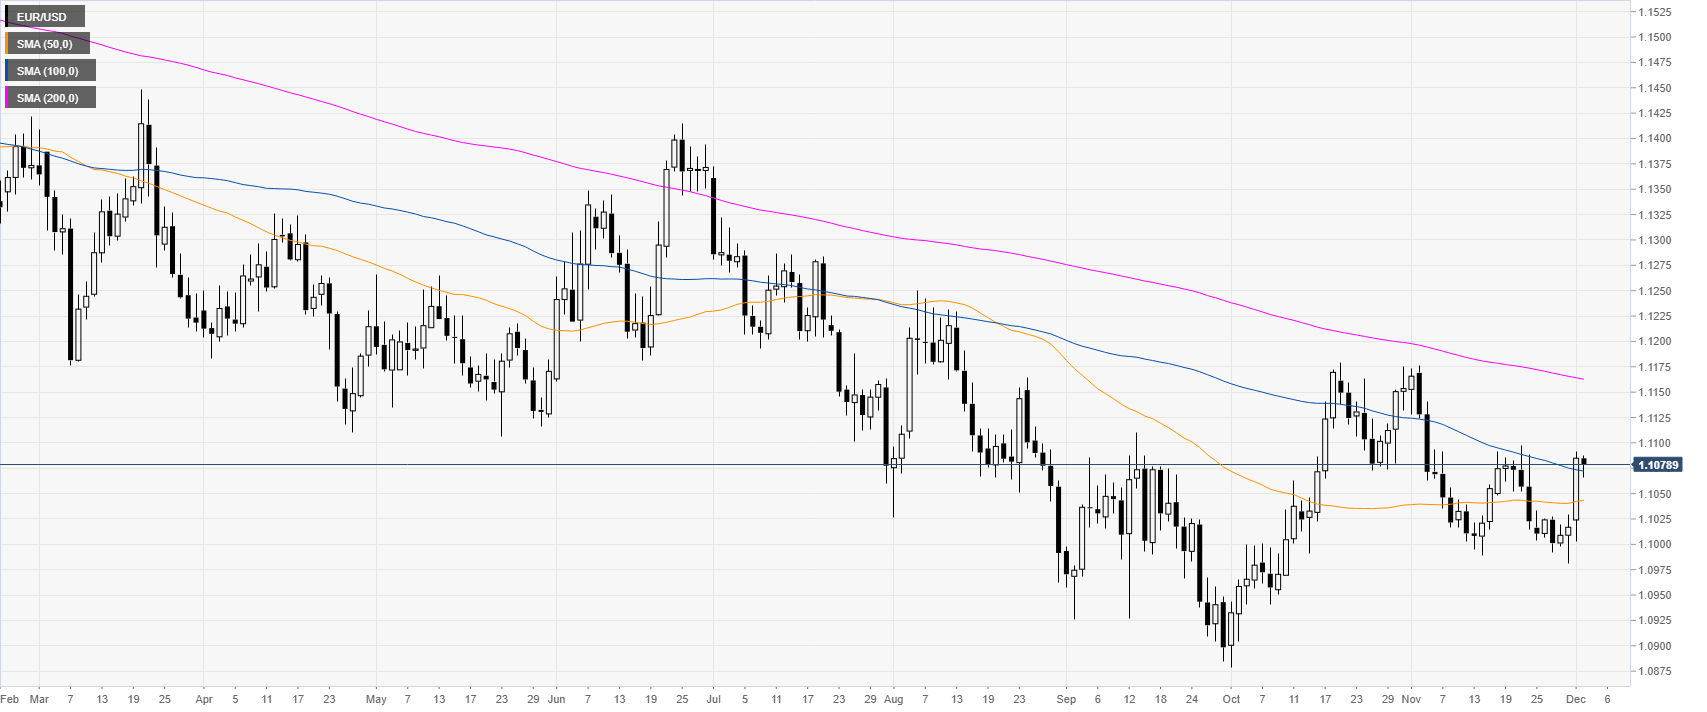
EUR/USD daily chart
EUR/USD on the daily chart is trading in a downtrend below the 200-day simple moving average (DMA). However, this Monday, the spot had a strong reversal up above the 1.1000 handle and the 50/100 SMAs.
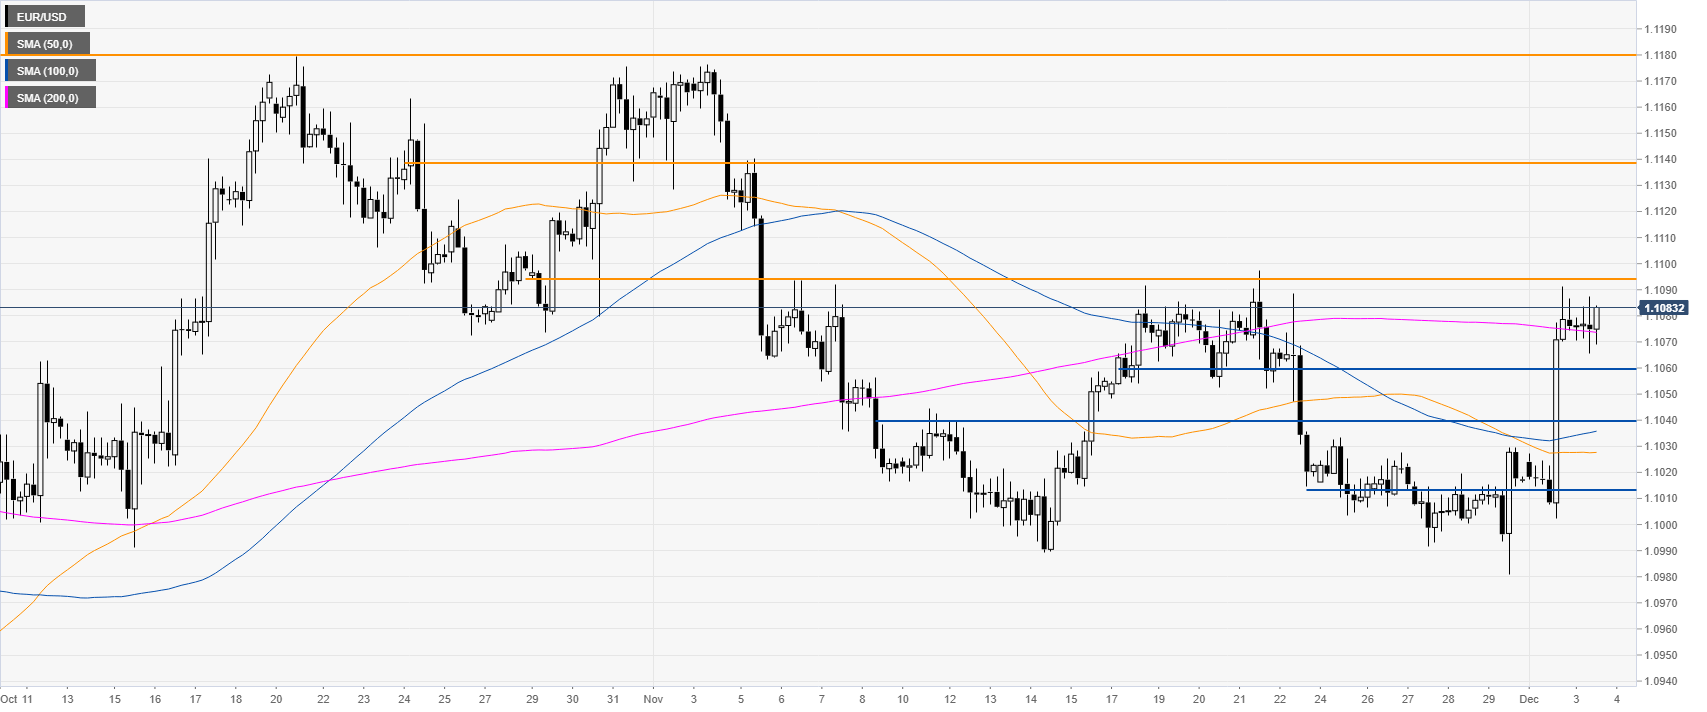
EUR/USD four-hour chart
EUR/USD is consolidating Monday’s bullish breakout above the 1.1059 support and the 200 SMA on the four-hour chart. There is an important resistance at 1.1093 and if the market overcomes it, the spot could continue to climb towards the 1.1139 level and possibly up to 1.1180 in the medium term, according to the Technical Confluences Indicator.
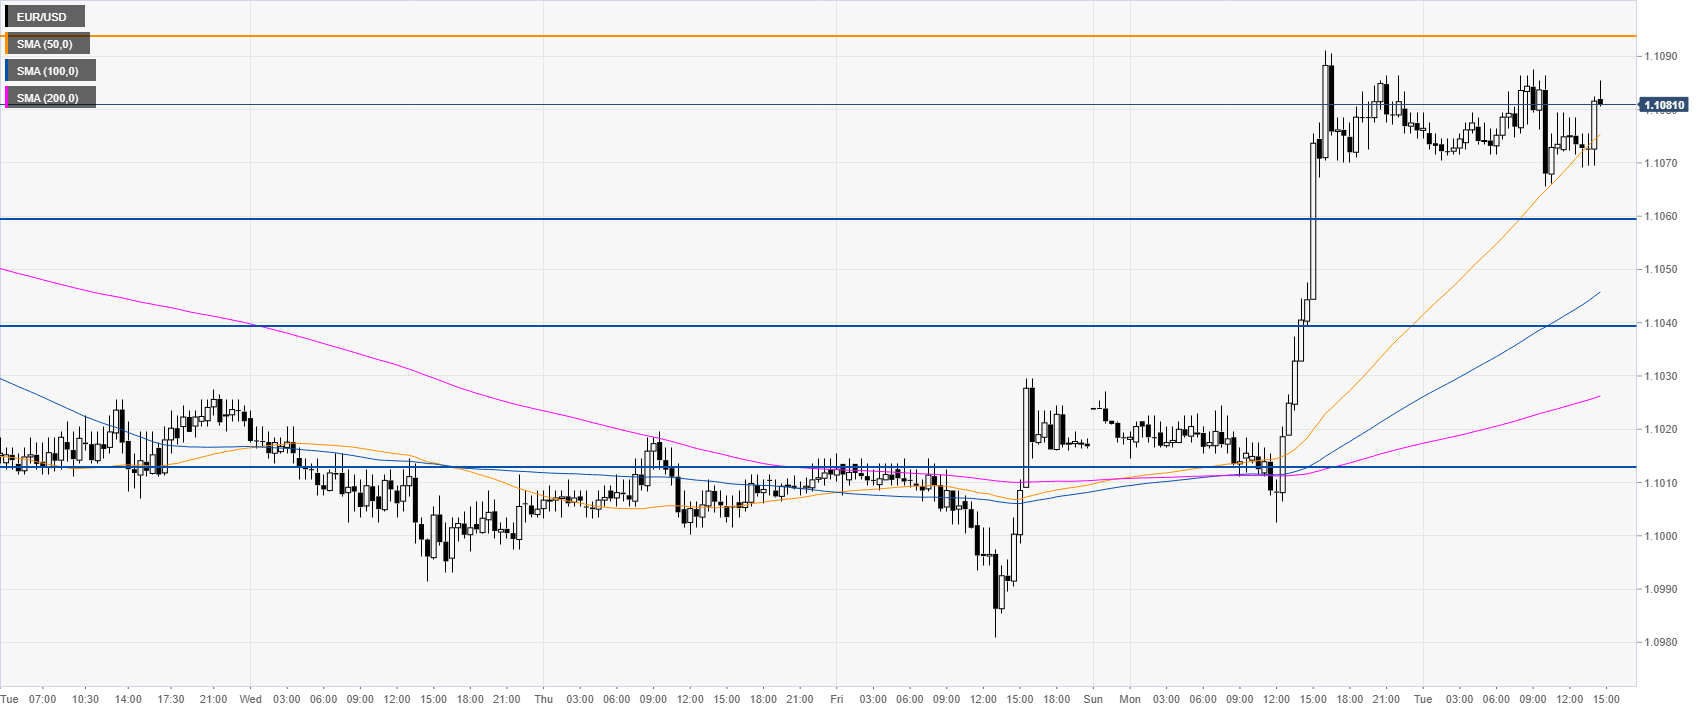
EUR/USD 30-minute chart
The market had an unusually big breakout on the first day of the week. Support can be seen at the 1.1059, 1.1040 and 1.1013 price levels, according to the Technical Confluences Indicator.
Additional key levels