Back
26 Nov 2019
Gold Technical Analysis: The metal erases daily losses, trades near 1460 level
- Gold is challenging the 1460 resistance.
- Follow-through buying could lead to the 1470 level.
- The outlook remains bearish in the medium term.
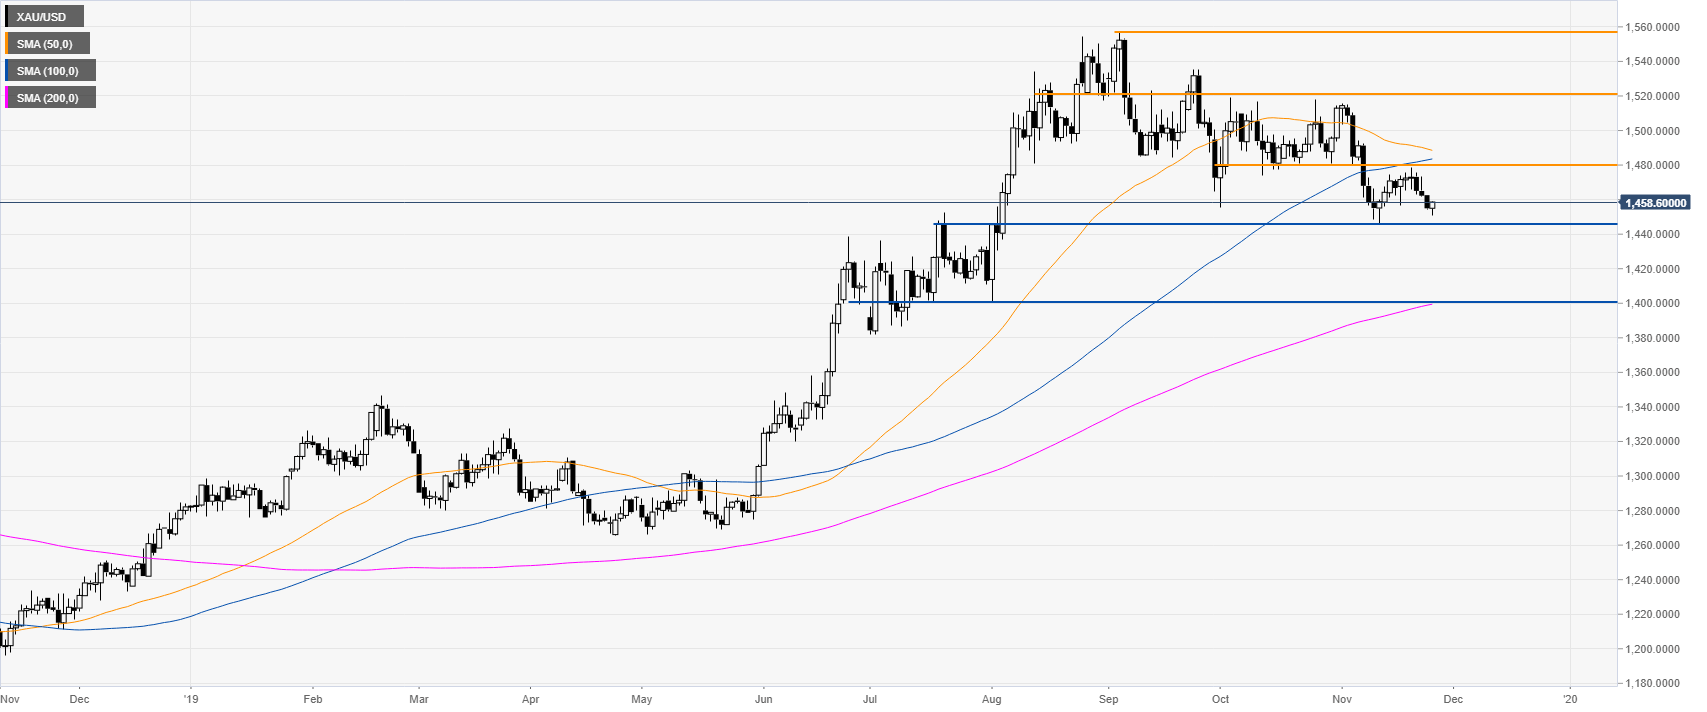
Gold daily chart
Gold is trading near the 1445 support level while below the 50 and 100 SMAs on the daily time frame. A breakdown below the 1445 swing low can lead to the next main support on the way down located near the 1400 handle.
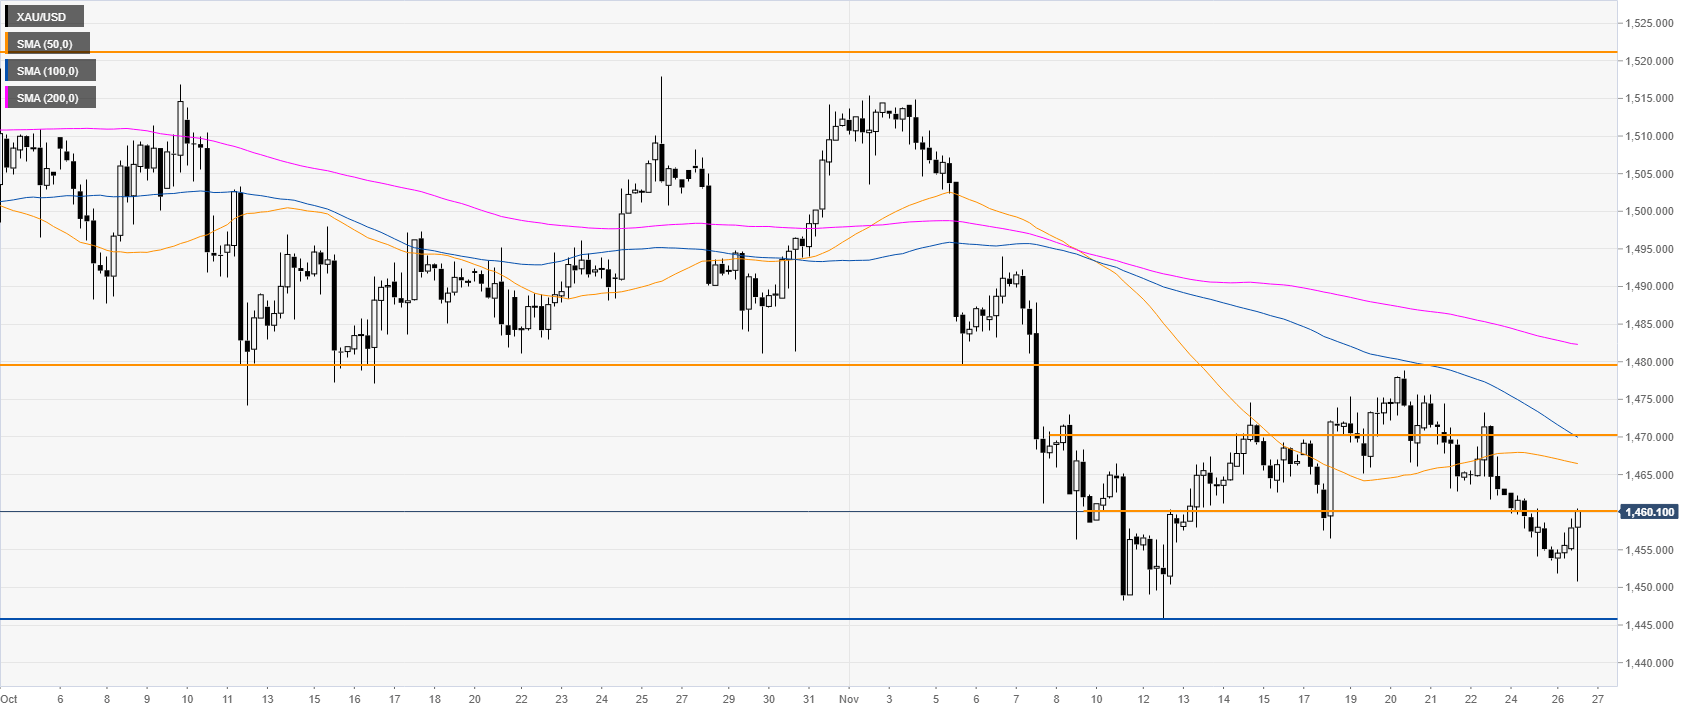
Gold four-hour chart
The market is challenging the 1460 resistance while trading below its main SMAs. If the market surpasses the level, the correction up could extend to the 1470 or 1480 level.
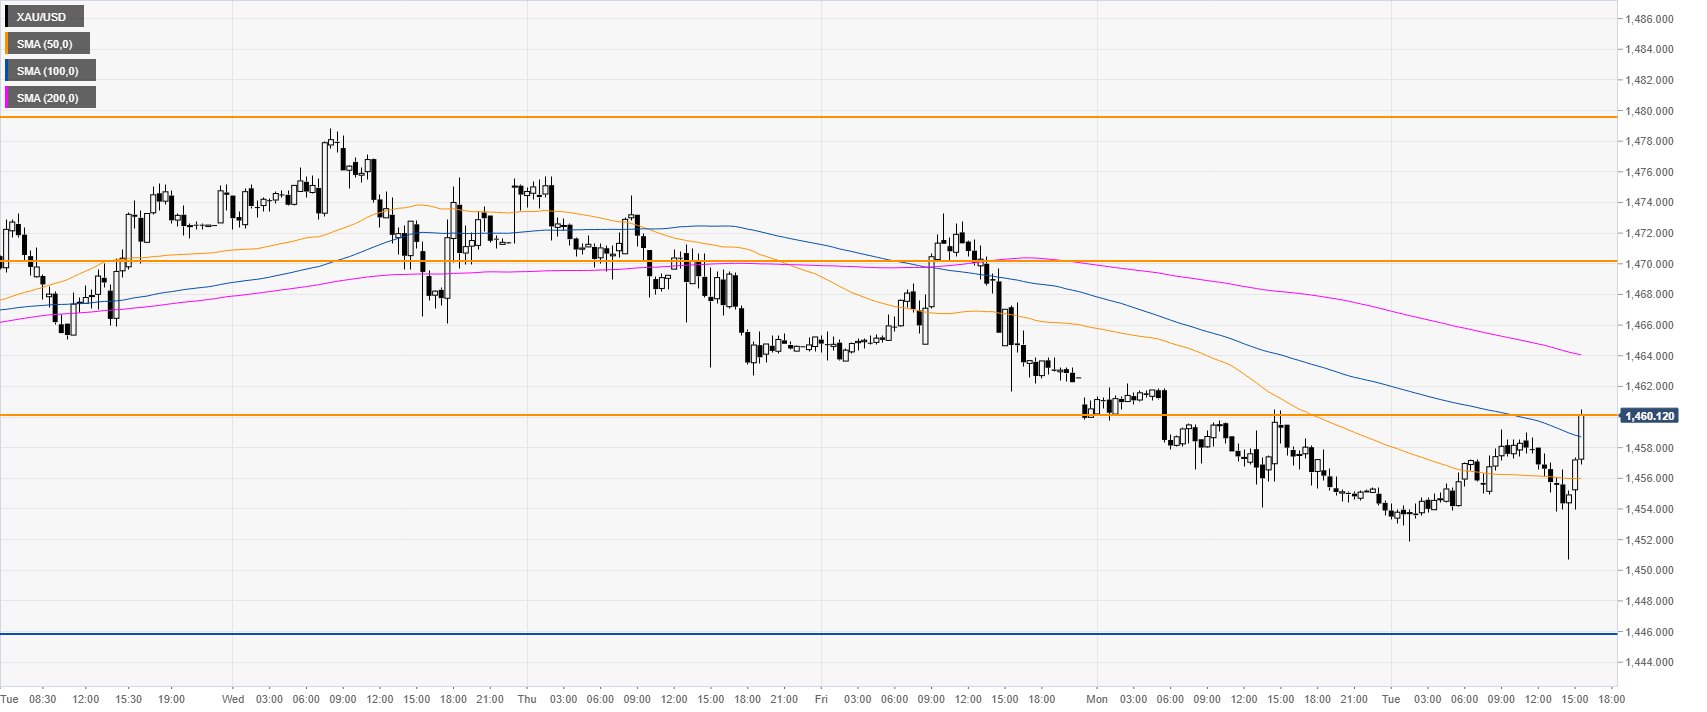
Gold 30-minute chart
The metal is reversing up sharply from daily lows and is now printing fresh daily highs below a downward sloping 200 SMA.
Additional key levels