AUD/JPY technical analysis: Rising wedge, 50-bar SMA stop sellers above 74.80/75
- AUD/JPY extends pullback from late-July highs.
- The quote nears key support confluence amid bearish MACD.
Despite witnessing a pullback from the highest since July 26, AUD/JPY still stays above the key support confluence while taking rounds to 75.00 during early Asian morning on Thursday.
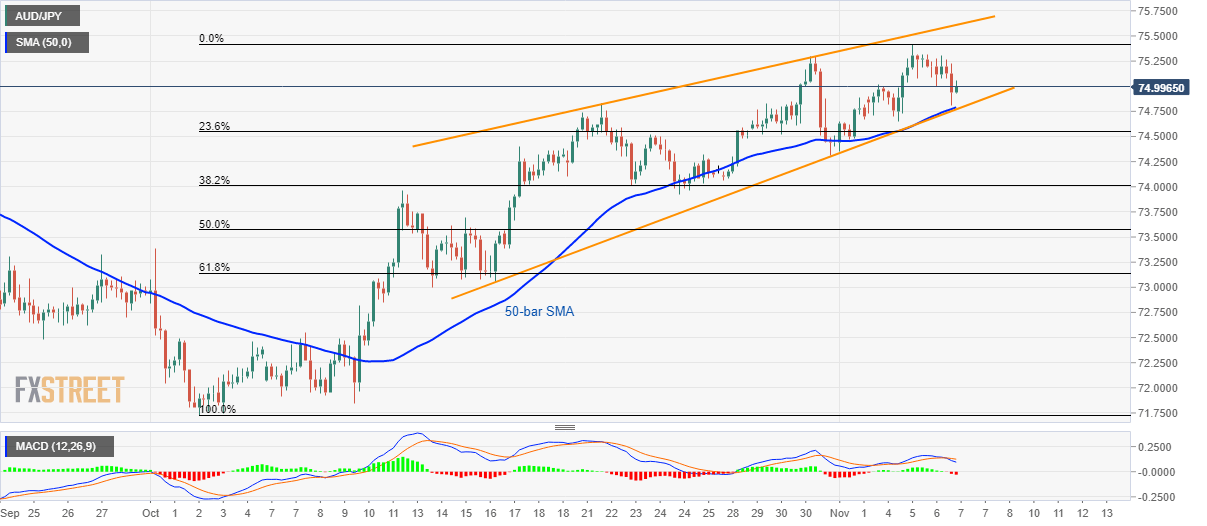
The pair trades above the support line of a short-term rising wedge bearish formation together with 50-bar Simple Moving Average (SMA) around 74.80/75, a break of which could confirm the theoretical downside of the quote. Also increasing the odds of pair’s decline are the bearish signals from 12-bar Moving Average Convergence and Divergence (MACD) indicator.
In doing so, October 11 top surrounding 74.00 will be the intermediate stop before highlighting 61.8% Fibonacci retracement level of October-November upside, near 73.15.
During the additional south-run below 73.15, prices could revisit early-October levels close to 72.50 and 71.70.
Meanwhile, the recent highs around 75.45 and an upward sloping trend line since October 22, forming part of the bearish pattern, at 75.62 now, could entertain intra-day buyers in a case of pair’s U-turn.
AUD/JPY 4-hour chart
Trend: pullback expected