Back
9 Oct 2019
US Dollar Index technical analysis: DXY trading mixed above 99.00 ahead of the FOMC Minutes
- Market players will be watching the FOMC Minutes at 18:00 GMT.
- The 99.10 resistance is the level to beat for bulls.
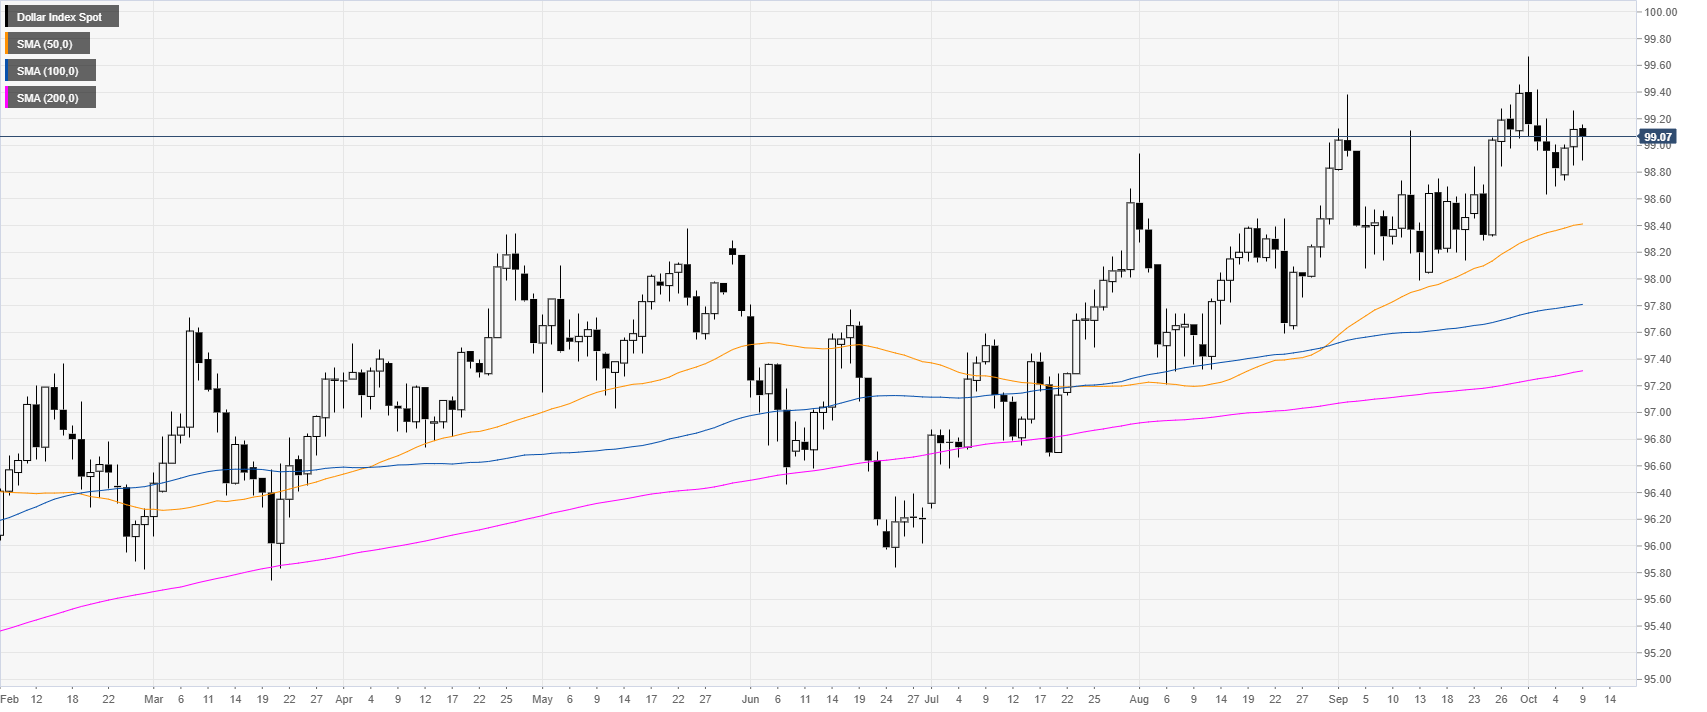
DXY daily chart
The US Dollar Index (DXY) is in a bull trend above the main daily simple moving averages (DSMAs). Market participants are waiting for the FOMC Minutes, although analysts don’t expect any fireworks.
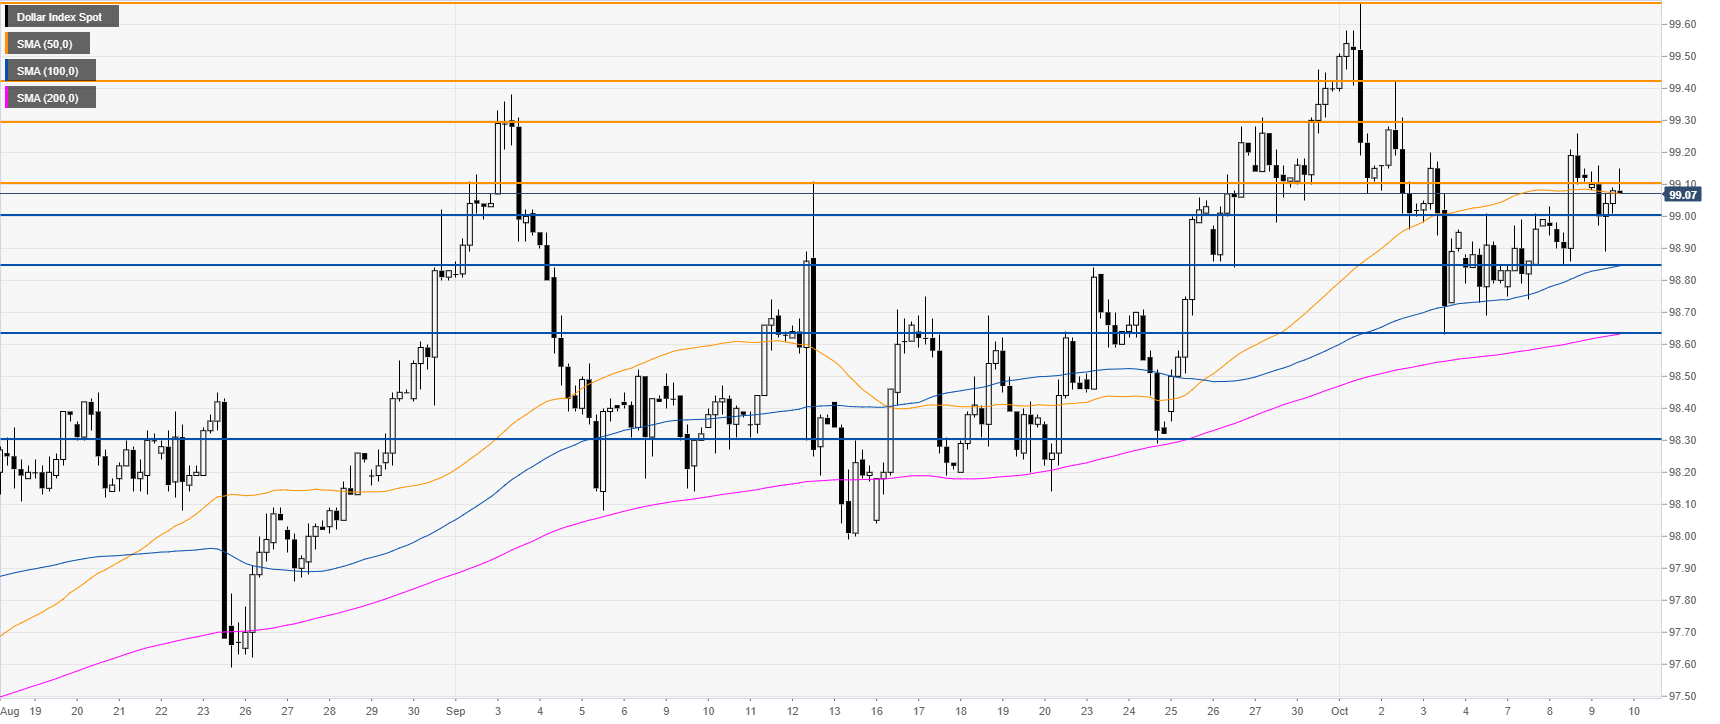
DXY four-hour chart
DXY is trading in the 99.00/99.10 band. The Greenback would need to daily close above 99.10 to open the gates towards 99.30/99.43 resistance zone.
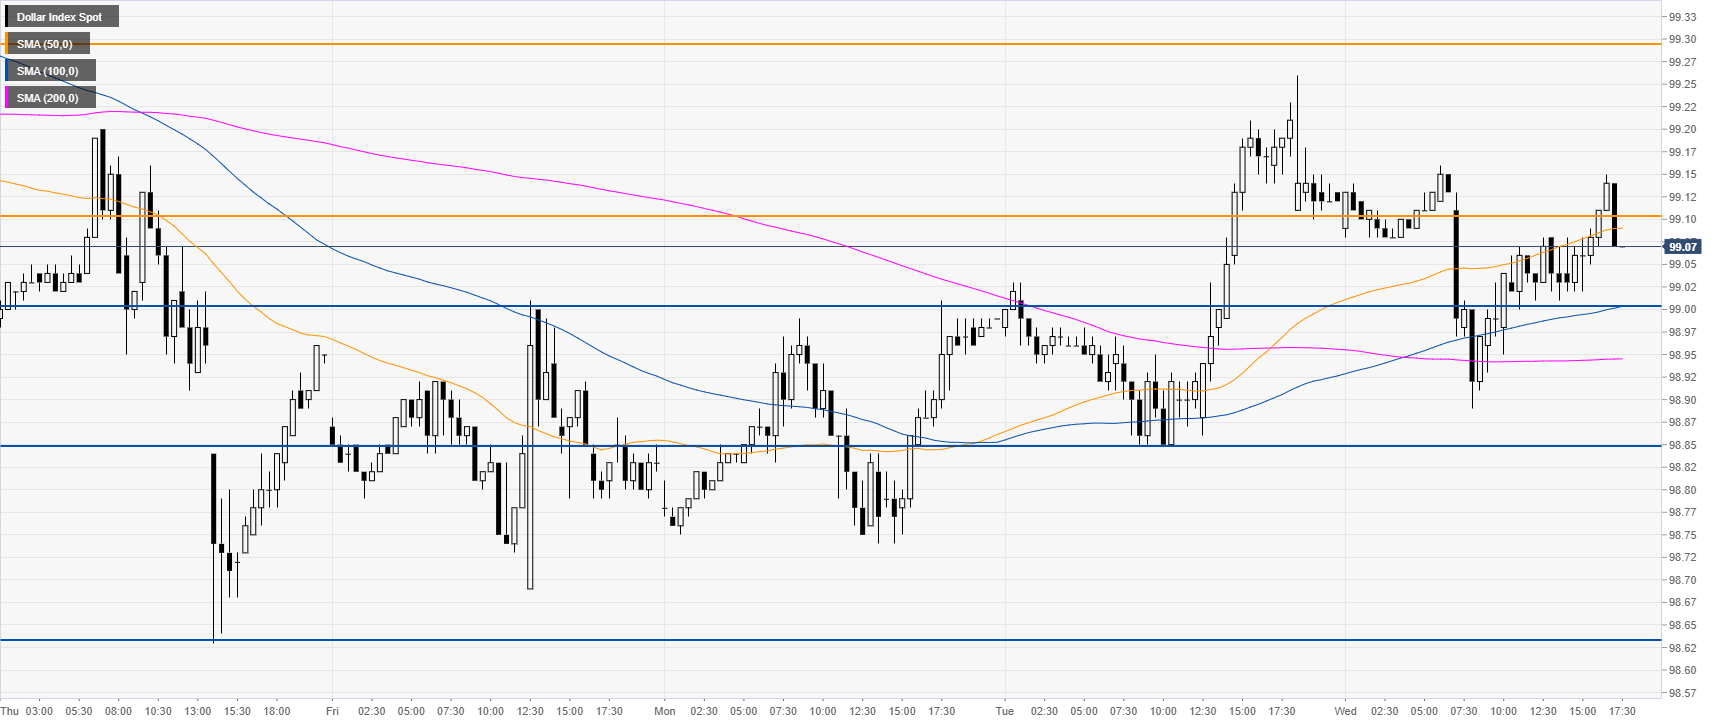
DXY 30-minute chart
DXY is trading above the 100 and 200 SMAs, suggesting bullish momentum in the short term. Support is seen at the 99.00 and 98.85 price levels.
Additional key levels