Back
18 Jul 2019
EUR/USD technical analysis: Fiber trades below 1.1230 after the London close
- The ECB and Italy’s politics keep the sentiment negative on the EUR.
- The level to beat for sellers are located at 1.1200 followed by 1.1164 to the downside.
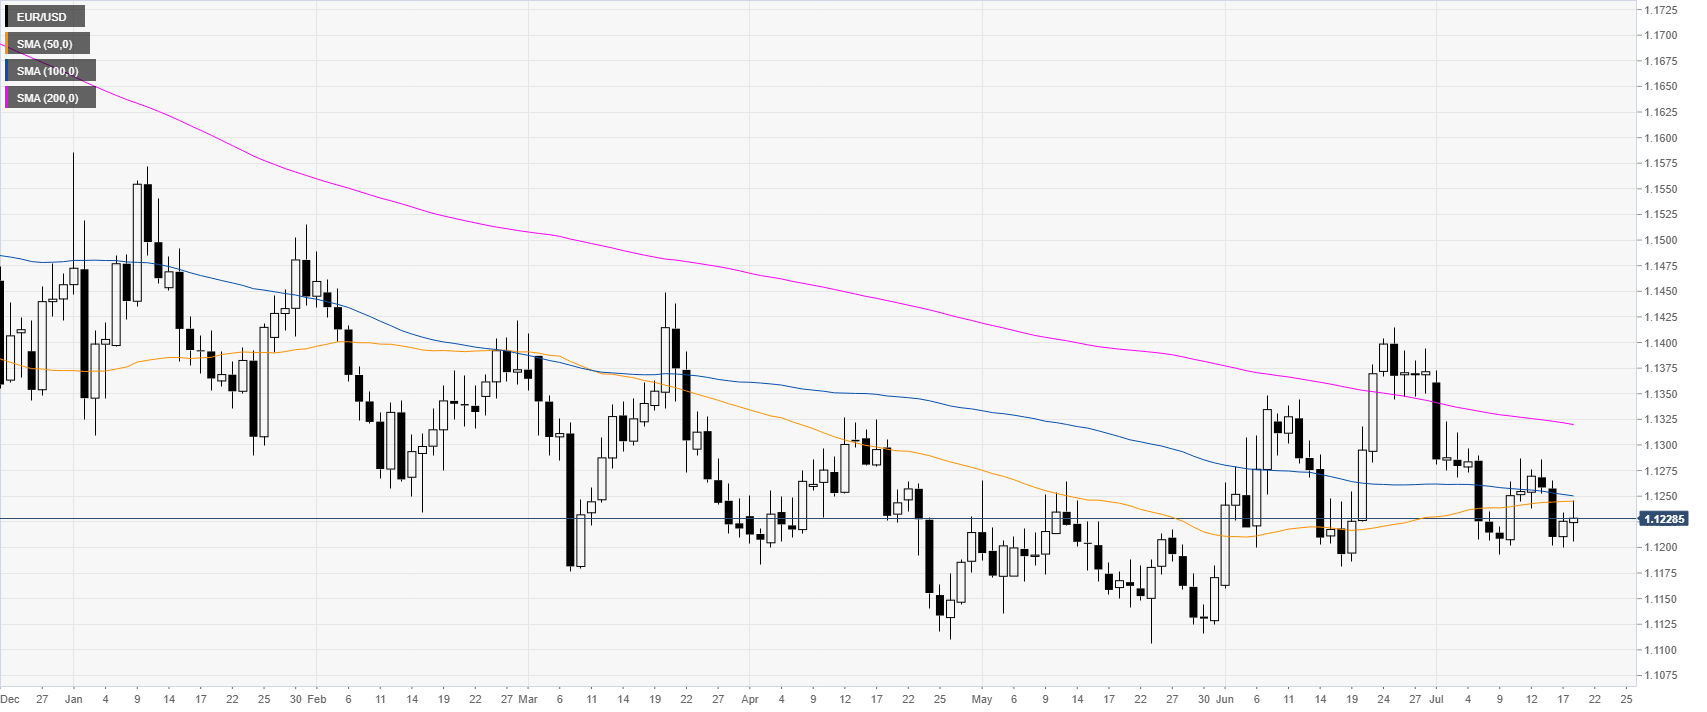
EUR/USD daily chart
EUR/USD is in a bear trend below the main daily simple moving average (DSMA). The ECB (European Central Bank) might reconsider its inflation target. Italy 5-Star Movement’s Di Maio said the Lega could overthrow the government. All adding to the negative sentiment on the EUR.
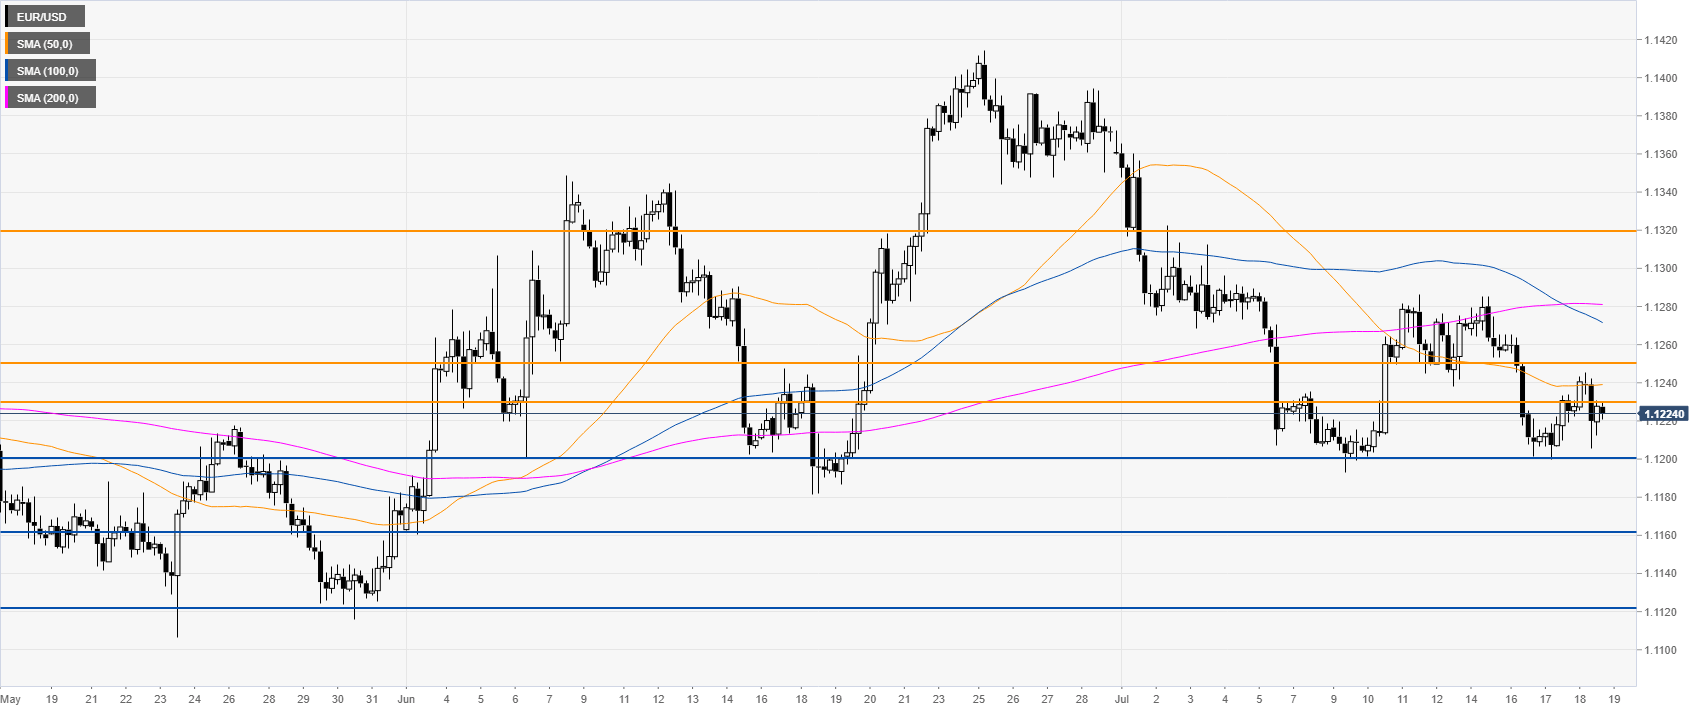
EUR/USD 4-hour chart
EUR/USD is constrained below the1.1230 resistance and the main SMAs. Bears need a break below 1.1200 to reach 1.1164 and 1.1120, according to the Technical Confluences Indicator.
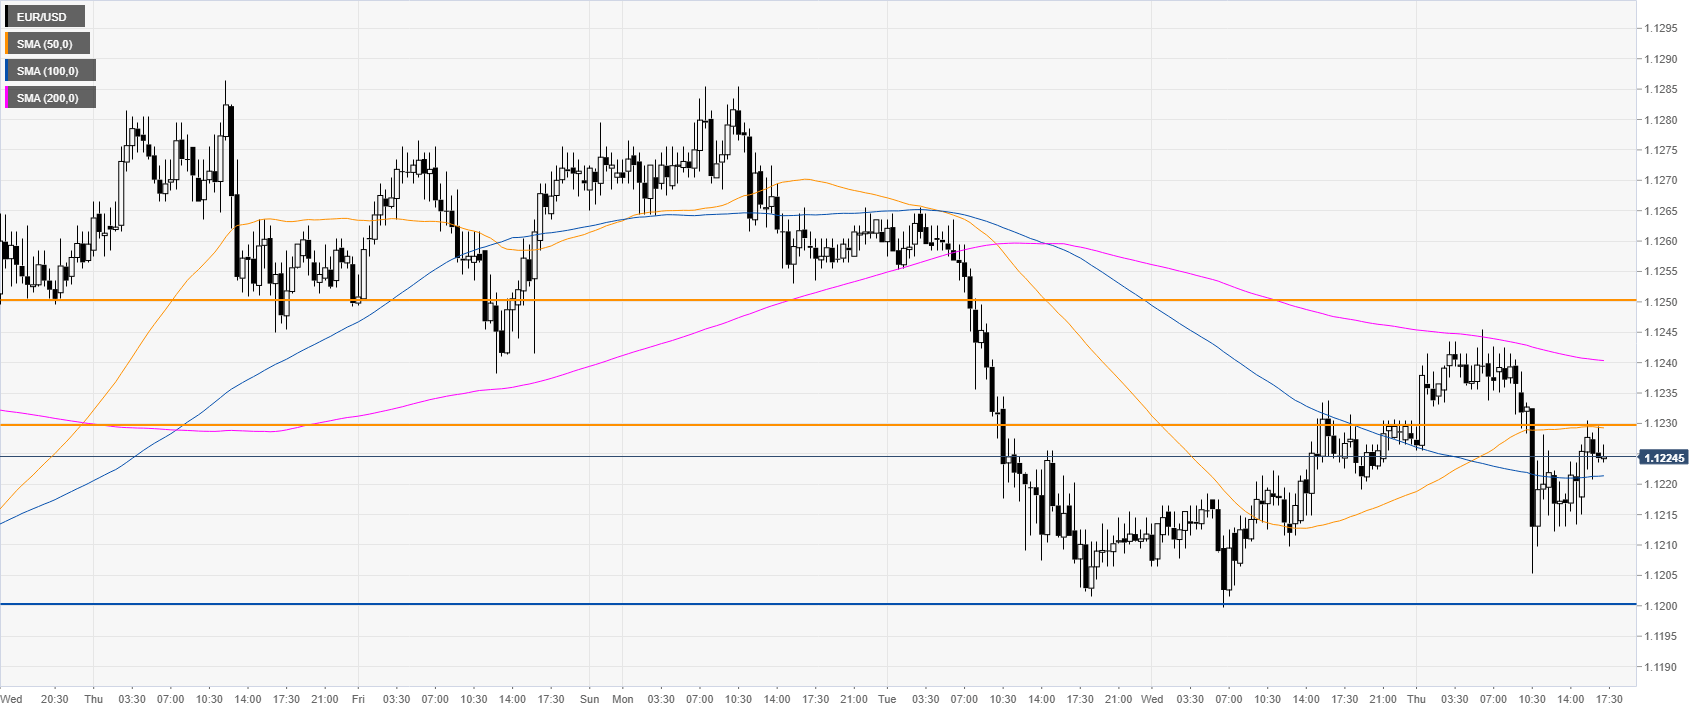
EUR/USD 30-minute chart
EUR/USD is under pressure below 1.1230 and the 50 SMA. Immediate resistances can be seen at 1.1230 and 1.1250, according to the Technical Confluences Indicator.
Additional key levels