Back
8 Jul 2019
S&P500 technical analysis: US stocks losing steam below the 3,000 big figure
- The S&P500 is retracing down below the 3,000 big figure.
- Immediate supports are seen at 2,950 and 2,910.
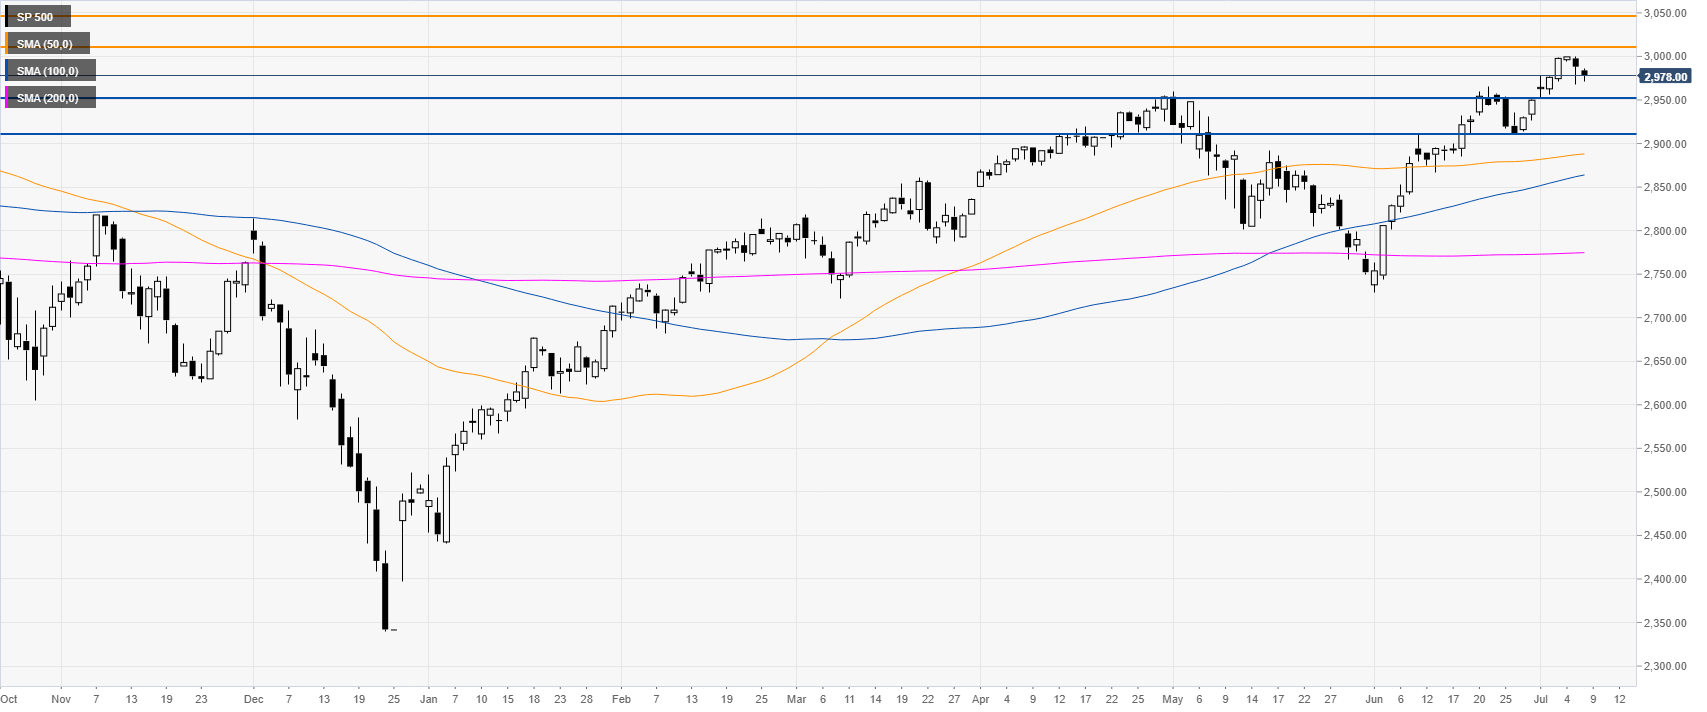
S&P500 daily chart
The S&P500 is retreating from below the 3,000 big figure. A break above that level is necesarry for market to continue to travel towards the 3,010 and 3,045 level.
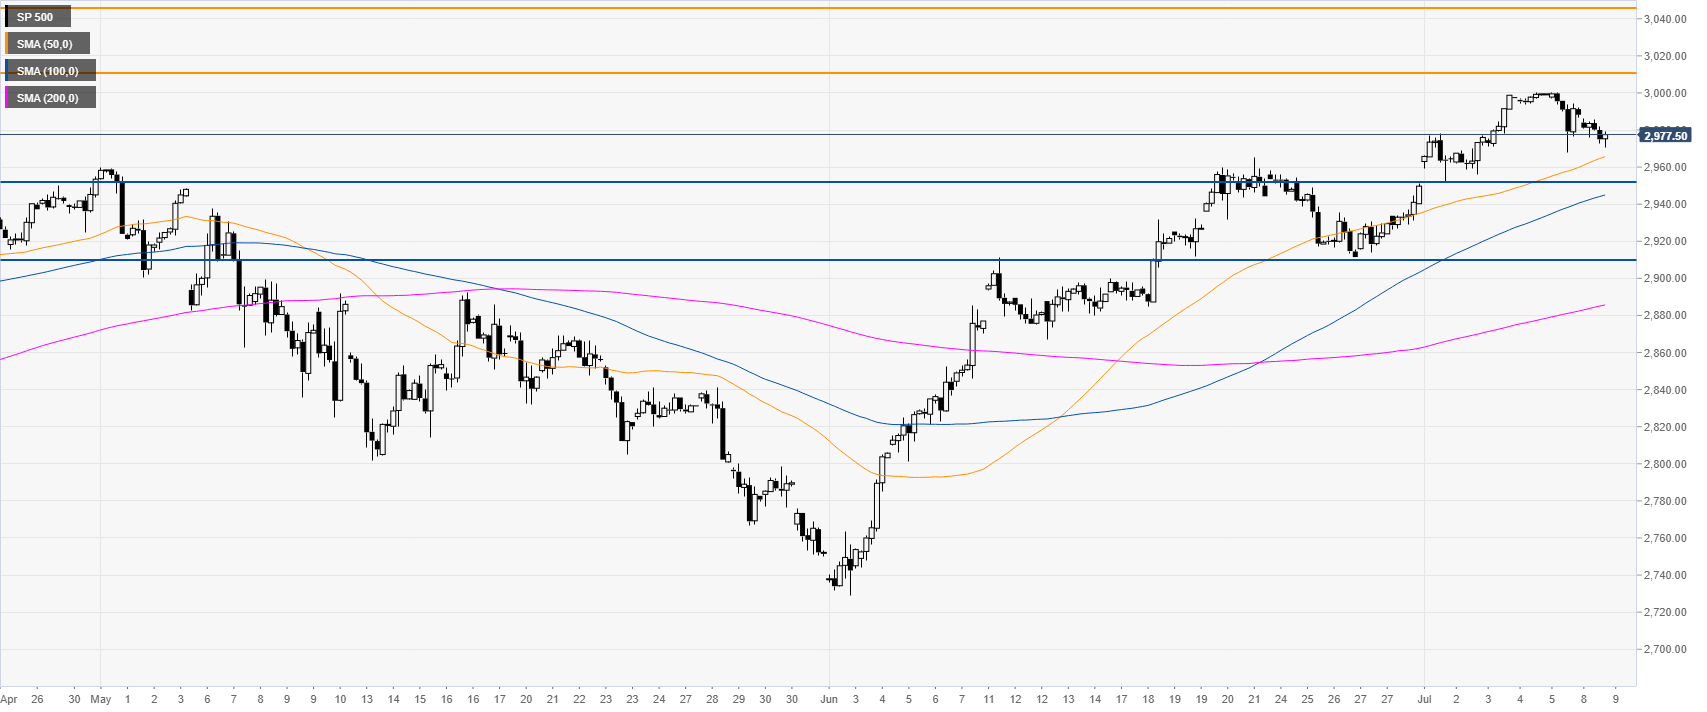
S&P500 4-hour chart
The market is trading above its main simple moving averages (SMAs), suggesting bullish momentum. However, in the event that the bulls fail, support is at the 2,950 level. If that level doesn’t hold, further down, 2,910 can be the next support.
Additional key levels