Back
21 Jun 2019
GBP/USD technical analysis: Cable bulls challenge the 1.2700 handle
- GBP/USD is trying to reclaim the daily highs.
- The level to beat for bulls is 1.2710.
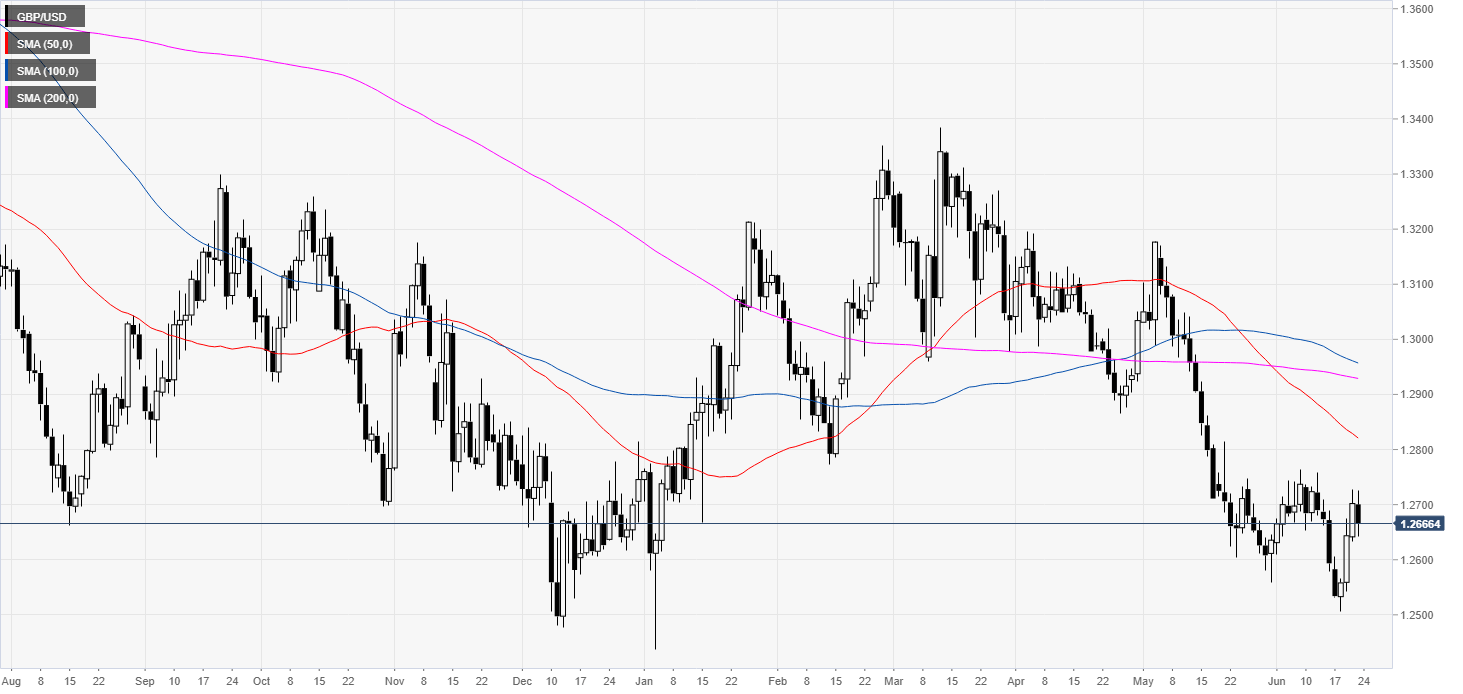
GBP/USD daily chart
GBP/USD is in a bear trend below its main simple moving averages. The market is currently finding some resistance near the 1.2700 handle.
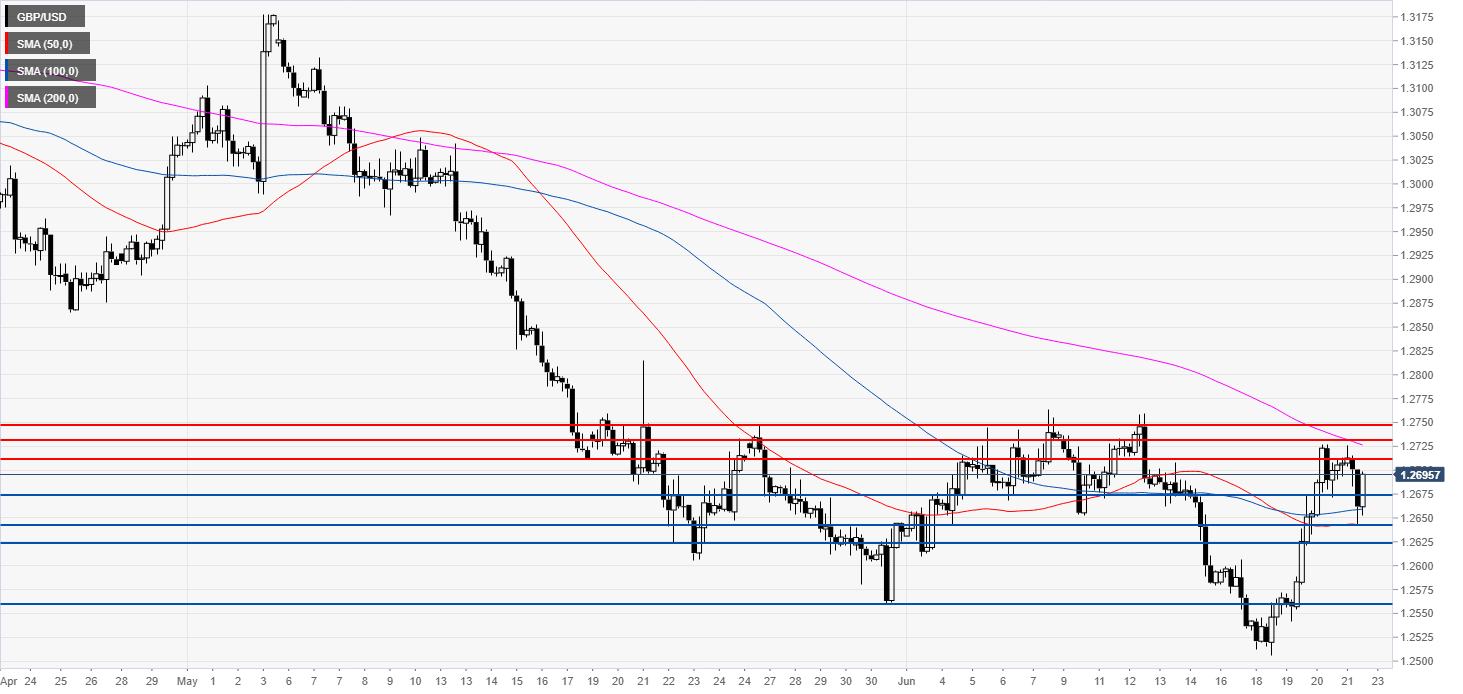
GBP/USD 4-hour chart
Cable is consolidating the recent gains below 1.2700 and the 200 SMA. Resistance is at 1.2710, 1.2730 and 1.2745 according to the Technical Confluences Indicator.
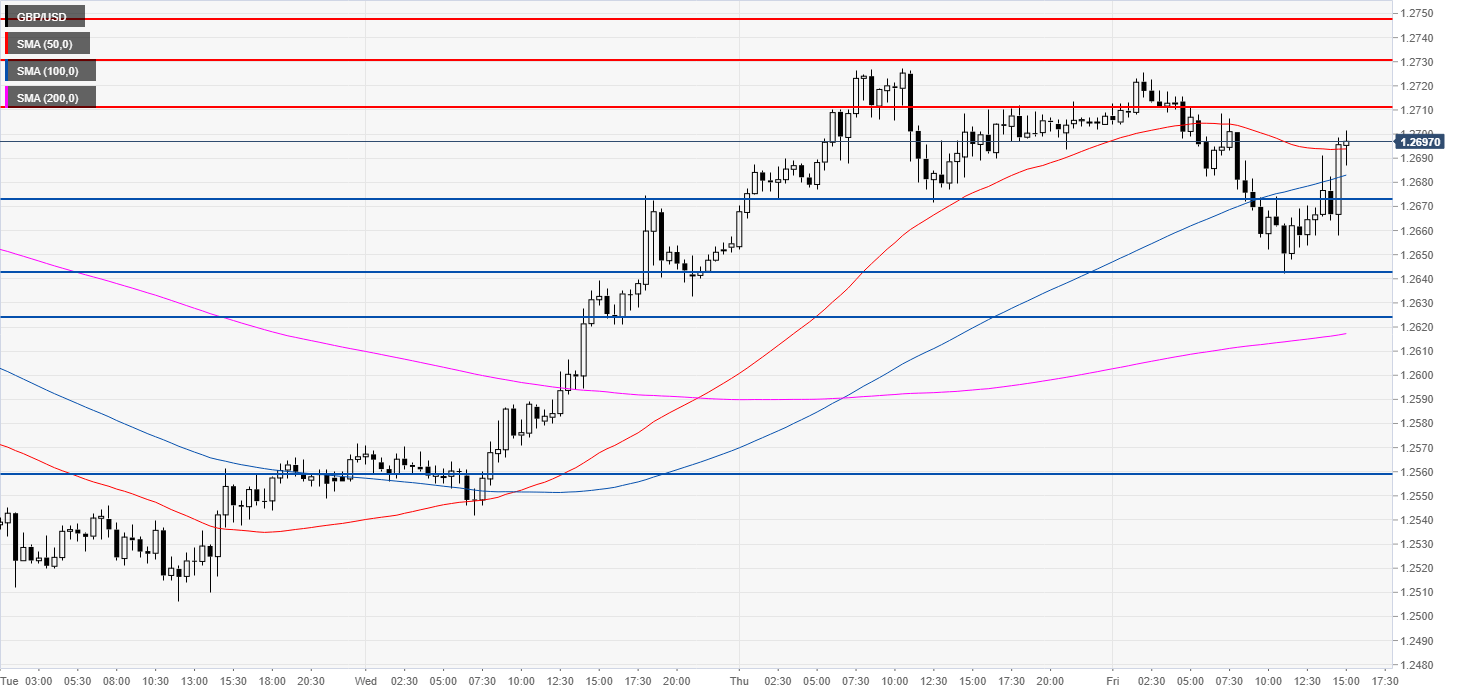
GBP/USD 30-minute chart
GBP/USD is trading above its main SMAs suggesting a bullish bias in the short term. The 1.2670 and 1.2640 levels are seen as immediate support according to the Technical Confluences Indicator. Further down lies 1.2624 and 1.2560 support
Additional key levels