Back
15 Apr 2019
Oil Technical Analysis: WTI starts the week with a slump towards $63.00 a barrel
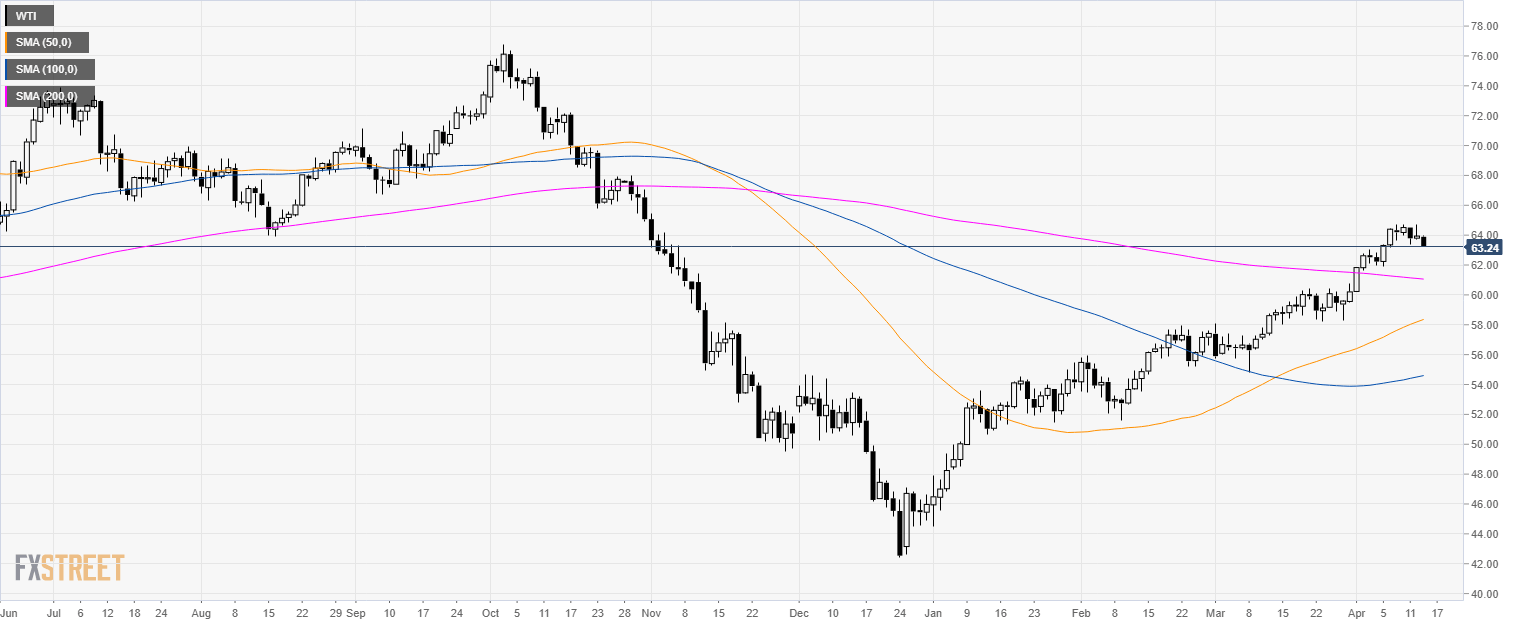
Oil daily chart
- WTI is trading in a bull trend above its main simple moving averages (SMAs).

Oil 4-hour chart
- Crude oil WTI is trading below its main 50 SMA suggesting a correction in the medium-term.

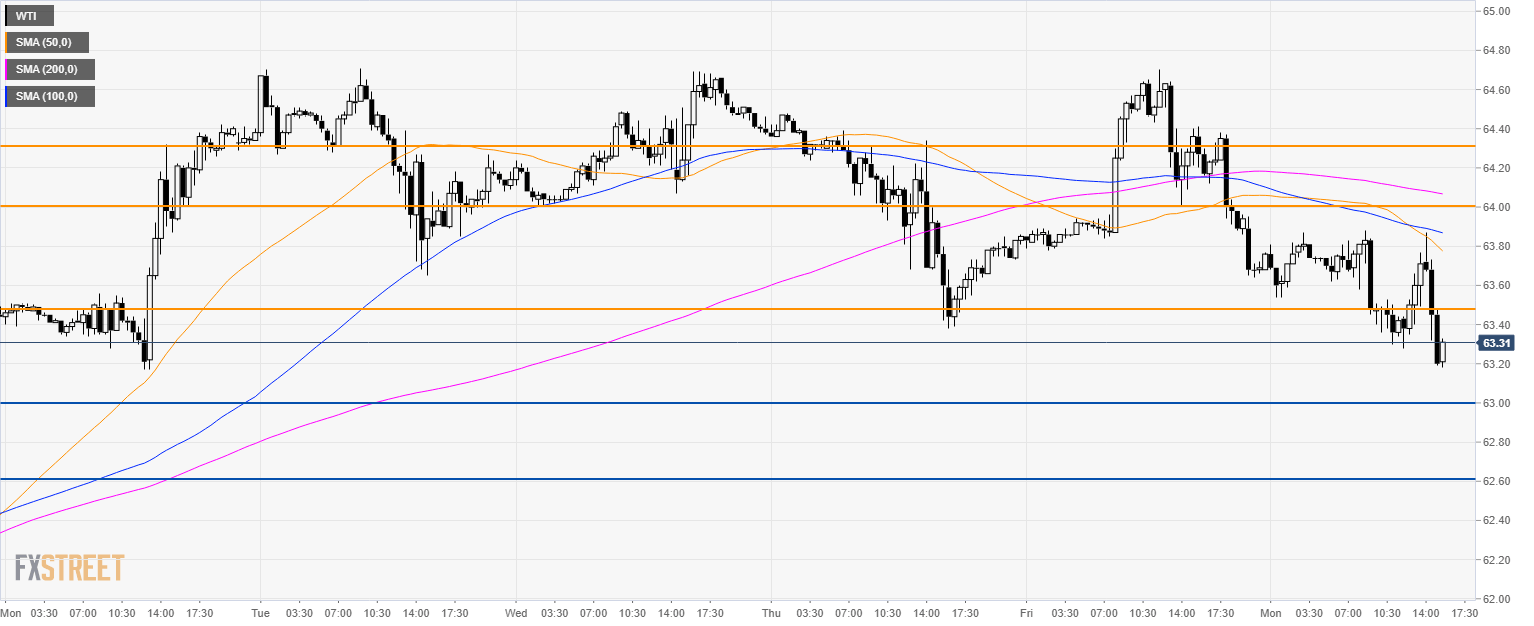
Oil 30-minute chart
- WTI is trading below its main SMAs suggesting a bearish bias in the short-term.
- The market can decline towards 63.00 and 62.60 level.
- Resistance is seen at 63.50 and 64.00 figure.

Additional key levels
