Back
22 Mar 2019
USD/CHF Technical Analysis: Bounce from 38.2% Fibonacci retracement struggle with 200-day SMA
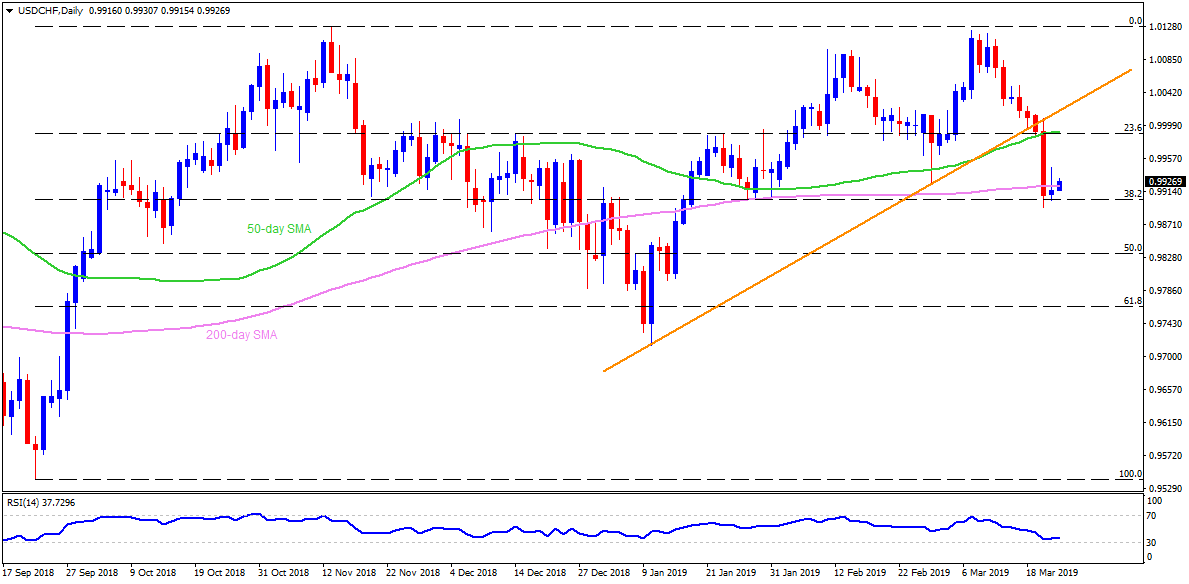
USD/CHF daily chart
- The USD/CHF pair trades near 0.9930 at the early Asian session on Friday.
- The quote recently bounced off the 38.2% Fibonacci retracement of its September – November 2018 upside but is struggling around 200-day simple moving average (SMA) level of 0.9920.
- Should the pair successfully cross 0.9920, 0.9960 can act as immediate resistance ahead of highlighting 0.9990 confluence comprising 50-day SMA and 23.6% Fibonacci.
- During the pair’s additional rise above 0.9990, 1.000 round-figure and support-turned-resistance line around 1.0020 can challenge buyers targeting 1.0055.
- On the downside break of 0.9900 Fibonacci figure, 0.9855, 0.9800 and 0.9780 could please sellers before challenging them with 61.8% Fibonacci retracement level of 0.9765.
- Additionally, 0.9700 and 0.9640 might become Bears’ favorites after 0.9765.

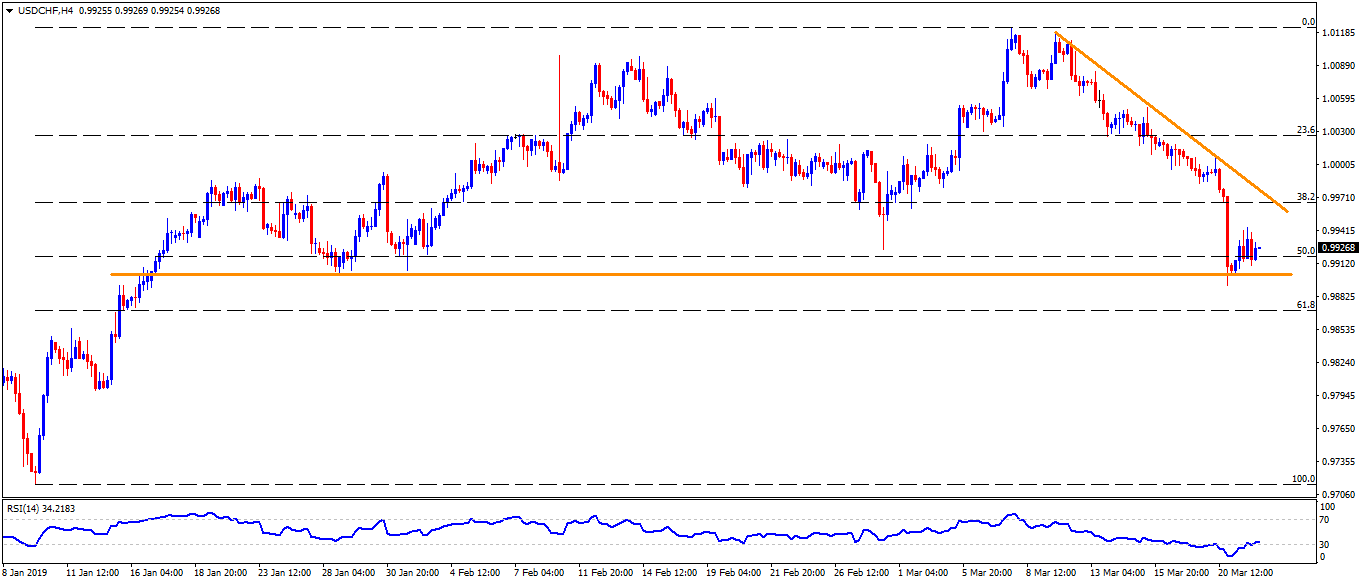
USD/CHF 4-Hour chart
- Short-term descending trend-line can offer intermediate resistance around 0.9980 between 0.9960 and 0.9990.
- 0.9820 may act as a buffer between 0.9855 and 0.9800.

USD/CHF hourly chart
- Recent highs around 0.9945 could provide the closest resistance to the pair.
- Also, 61.8% Fibonacci expansion of moves from March 20, at 0.9875, might become adjacent support past-0.9900.

