GBP/USD Technical Analysis: Cable trading just below the 1.2900 figure as bulls challenge the 100-day simple moving average
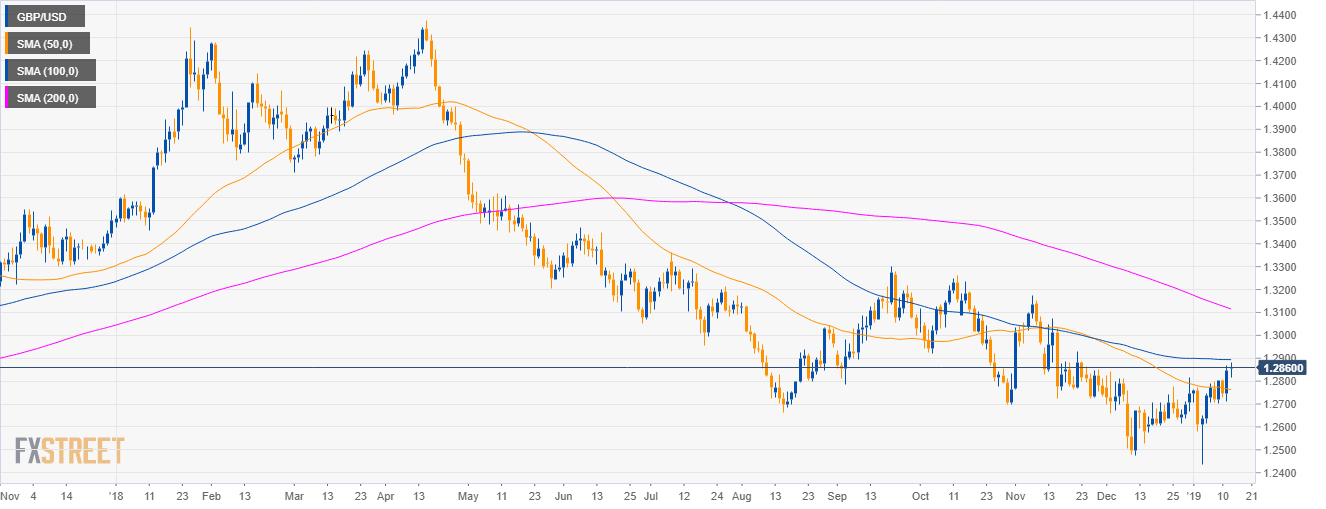
GBP/USD daily chart
- GBP/USD is trading in a bear trend below its 200-period simple moving averages (SMAs).
- GBP/USD bears are challenging the 1.2900 figure and the 100 DSMA (Daily SMA).
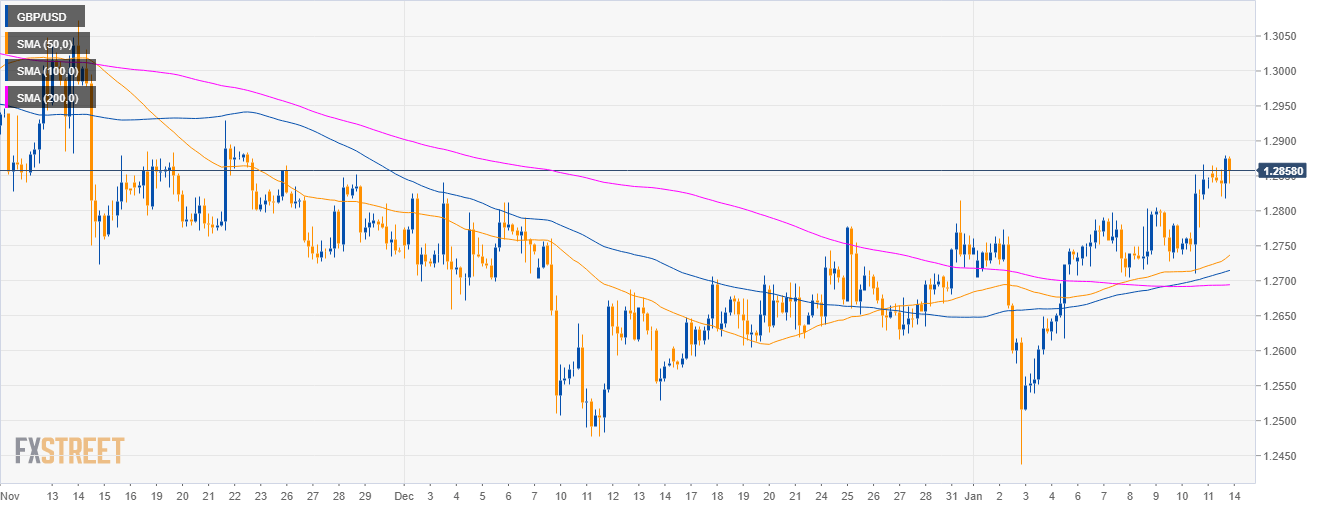
GBP/USD 4-hour chart
- GBP/USD is near monthly highs as it is trading above its main SMAs.
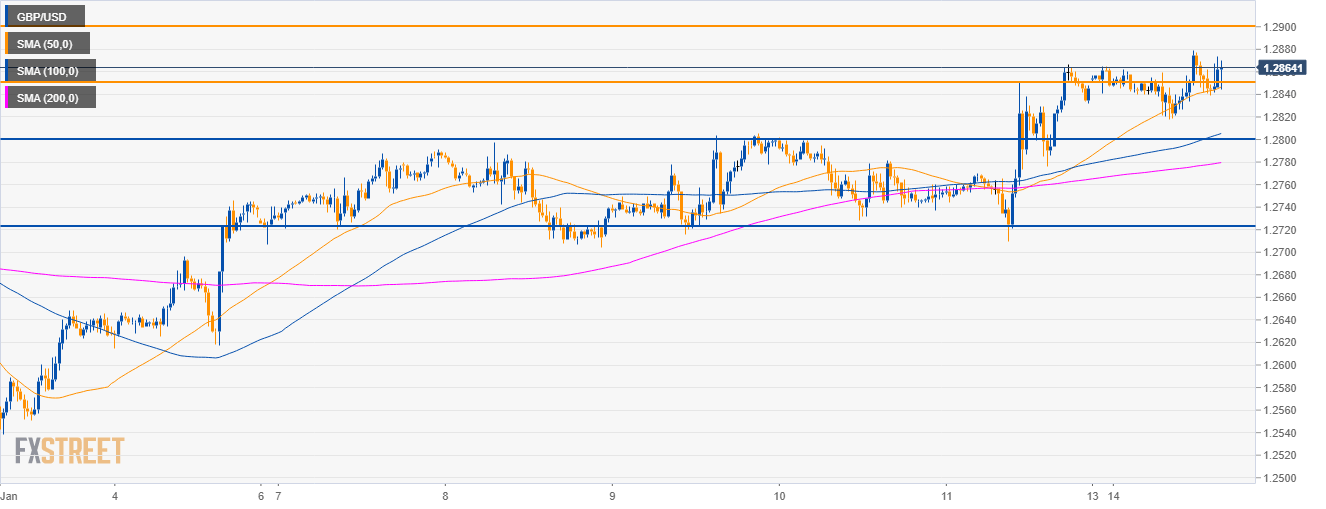
GBP/USD 30-minute chart
- GBP/USD is trading above its main SMAs as bulls want to break above the 1.2900 figure.
- A break above the current resistance would open the doors to 1.3000 the figure.
- Alternatively, if bears resume the main bear trend the 1.2800 level is the bearish target followed by 1.2720 in the coming sessions.
Additional key levels
GBP/USD
Overview:
Today Last Price: 1.2862
Today Daily change: 16 pips
Today Daily change %: 0.125%
Today Daily Open: 1.2846
Trends:
Previous Daily SMA20: 1.2696
Previous Daily SMA50: 1.2766
Previous Daily SMA100: 1.2894
Previous Daily SMA200: 1.3124
Levels:
Previous Daily High: 1.2866
Previous Daily Low: 1.271
Previous Weekly High: 1.2866
Previous Weekly Low: 1.2704
Previous Monthly High: 1.284
Previous Monthly Low: 1.2477
Previous Daily Fibonacci 38.2%: 1.2807
Previous Daily Fibonacci 61.8%: 1.277
Previous Daily Pivot Point S1: 1.2748
Previous Daily Pivot Point S2: 1.2651
Previous Daily Pivot Point S3: 1.2592
Previous Daily Pivot Point R1: 1.2905
Previous Daily Pivot Point R2: 1.2964
Previous Daily Pivot Point R3: 1.3061