Gold Technical Analysis: Struggles to make it through descending trend-channel hurdle near $1200 mark
• The precious metal is retreating from an important resistance marked by a short-term descending trend-channel formation on the 1-hourly chart.
• The commodity's inability to sustain above 100-hour SMA and move back above the key $1200 psychological mark further reinforces the bearish formation.
• Having said that, a convincing break through the mentioned barrier would invalidate the negative outlook and set the stage for further near-term up-move.
Gold 1-hourly chart
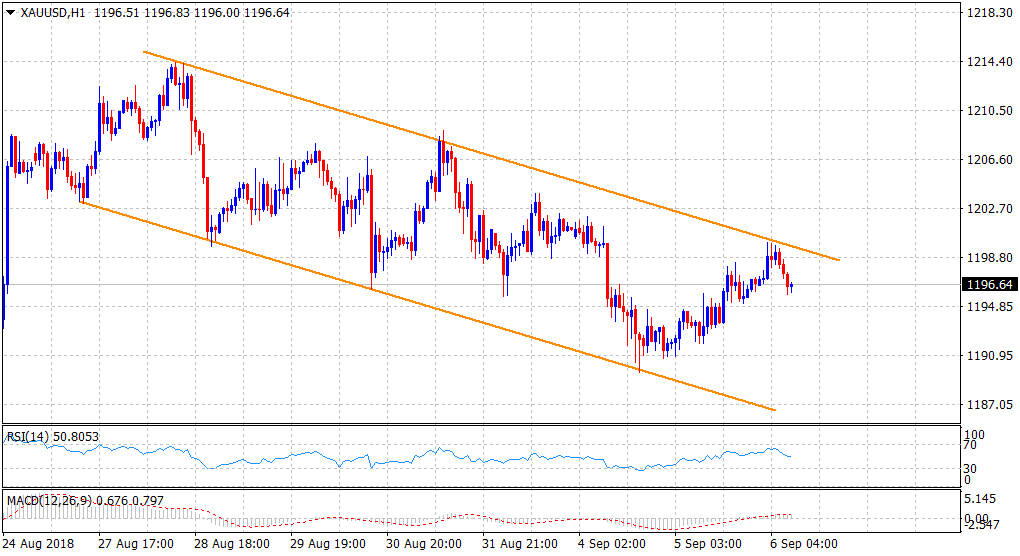
Spot Rate: $1196.64
Daily High: $1199.95
Trend: Bearish invalidation above $1200 mark
Resistance
R1: $1200 (round figure mark)
R2: $1203.90 (weekly high set on Monday)
R3: $1207.68 (R3 daily pivot-point)
Support
S1: $1192.06 (S1 daily pivot-point)
S2: $1189.66 (near two-week low set on Tuesday)
S3: $1184.65 (horizontal zone)