USD/JPY Price Prediction: Falls to base of Broadening Formation, threatens breakdown
- USD/JPY is testing the bottom of a probable bearish reversal pattern, attempting to break out.
- A decisive break below the baseline of the Broadening Formation would signal a reversal and probably more downside.
USD/JPY has fallen to test the lower border line of a bearish Broadening Formation price pattern (see chart below). The pair looks poised to break out lower. If so, it would signal a reversal of the trend and likely more downside on the horizon.
USD/JPY Daily Chart
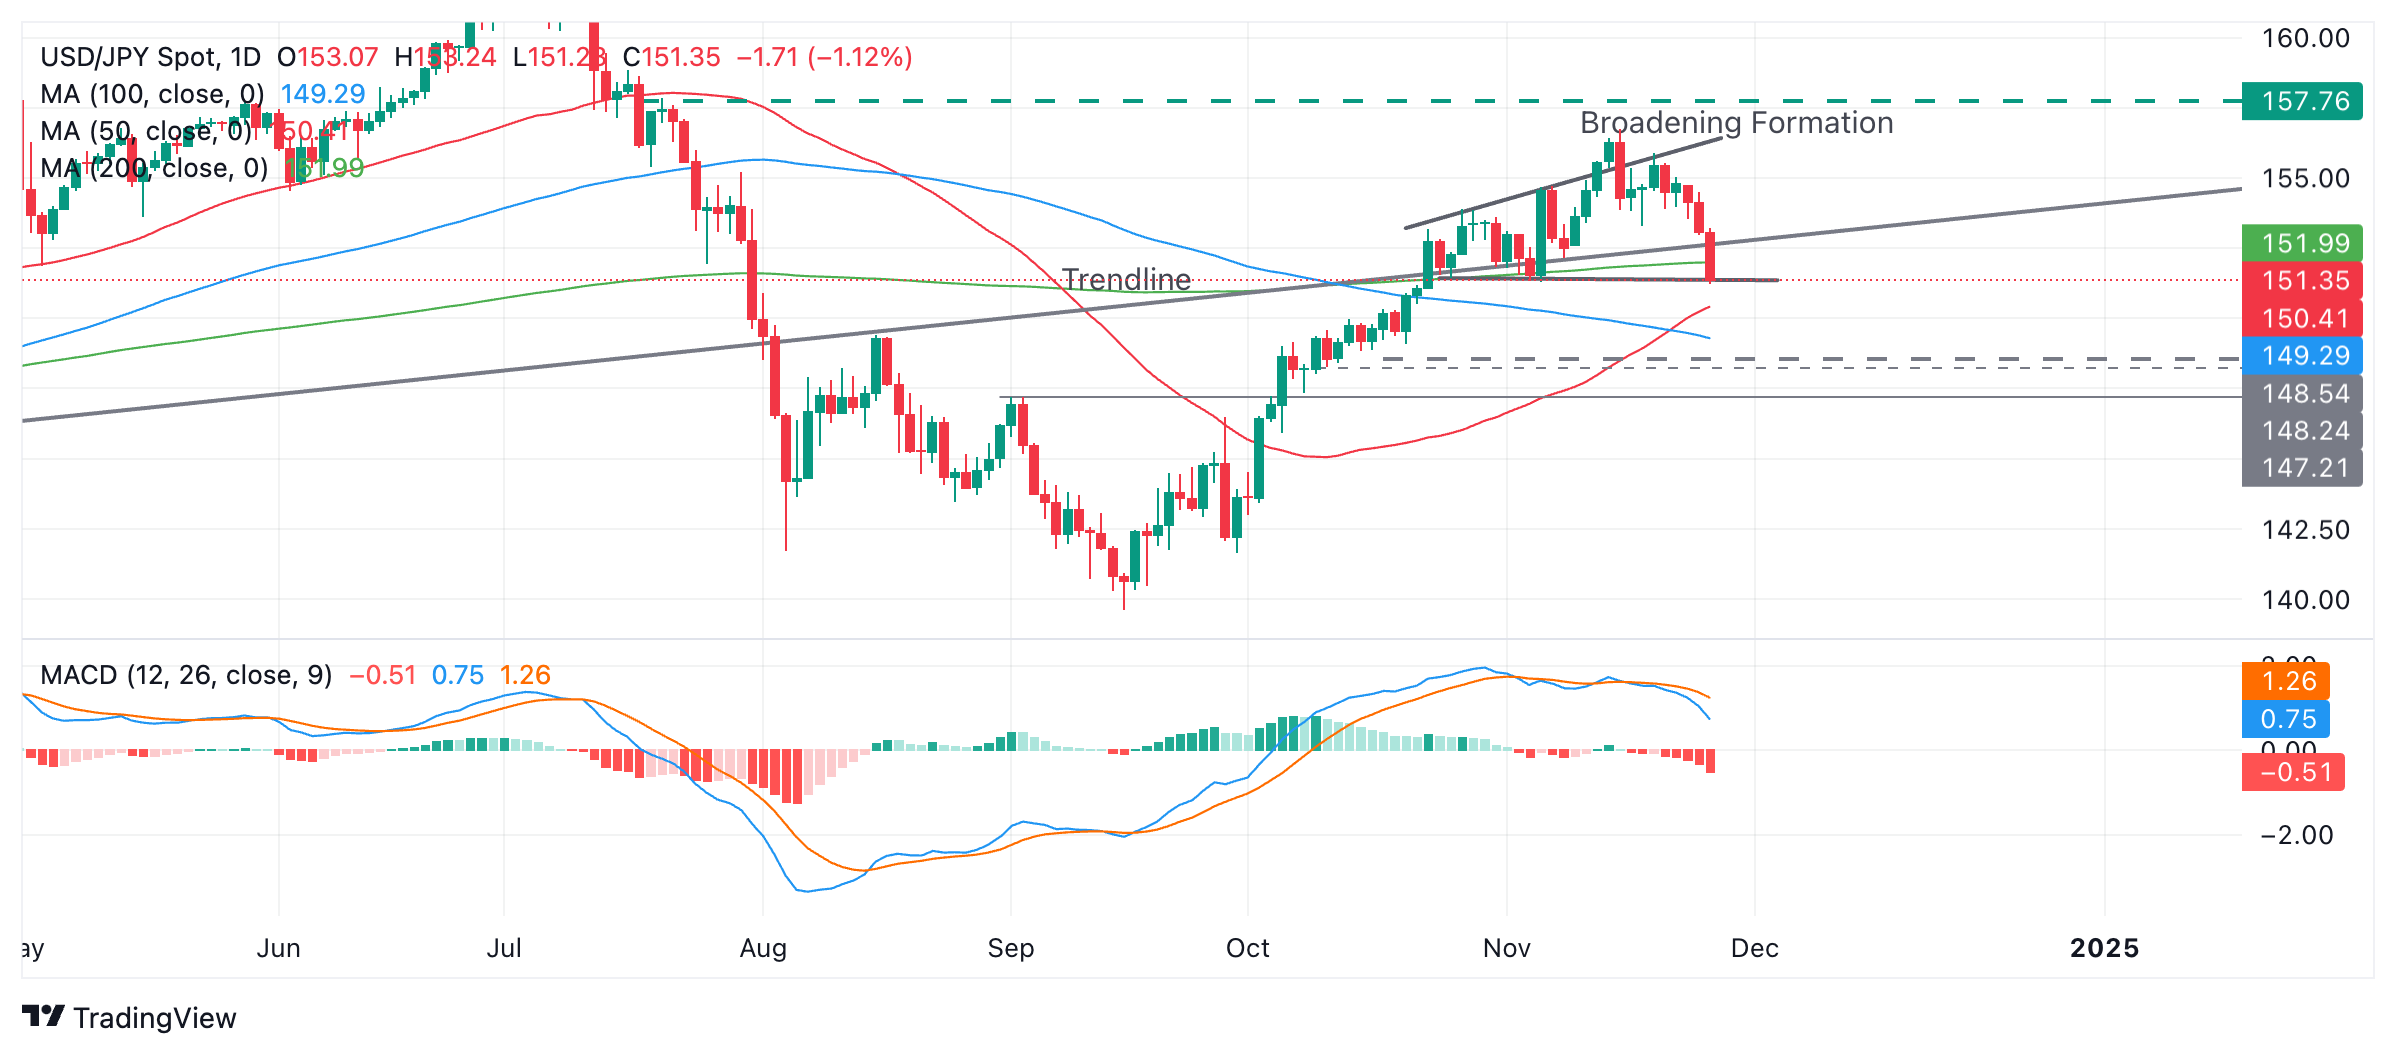
The (blue) Moving Average Convergence Divergence (MACD) momentum indicator has crossed below the red signal line and is diverging – a bearish indication.
A decisive break below the lower borderline of the Broadening Formation (BF) at about 151.50 would probably indicate a follow through to the target for the pattern at around 148.54.
A decisive break would be one accompanied by a long red candle that pierced clearly below the level and closed near its lows, or three red candles in a row that broke below the boundary.
Another possibility is that the pattern has not yet finished forming, in which case it could begin a new up leg within the boundary lines of the BF. This could either rally about half way up before pettering out or all the way up to the top of the pattern in the 156.00s. However, it is still too early to say whether either of these outcomes is likely to be the case.