Back
21 Nov 2023
GBP/JPY Price Analysis: Rebounds from weekly lows, eyes 186.30s
- GBP/JPY halts its bearish momentum, but downside risks remain if it fails to conquer the Tenkan-Sen.
- A ‘tweezers-bottom’ candlestick chart pattern is forming; further upside expected?
- Buyers failure to conquer 186.00, could exacerbate a drop toward the 184.50 area.
GBP/JPY snaps four days of losses, climbs 0.31% in the late Tuesday North American session, and exchanges hands at around 186.00 after bouncing from daily/weekly lows reached at 184.45.
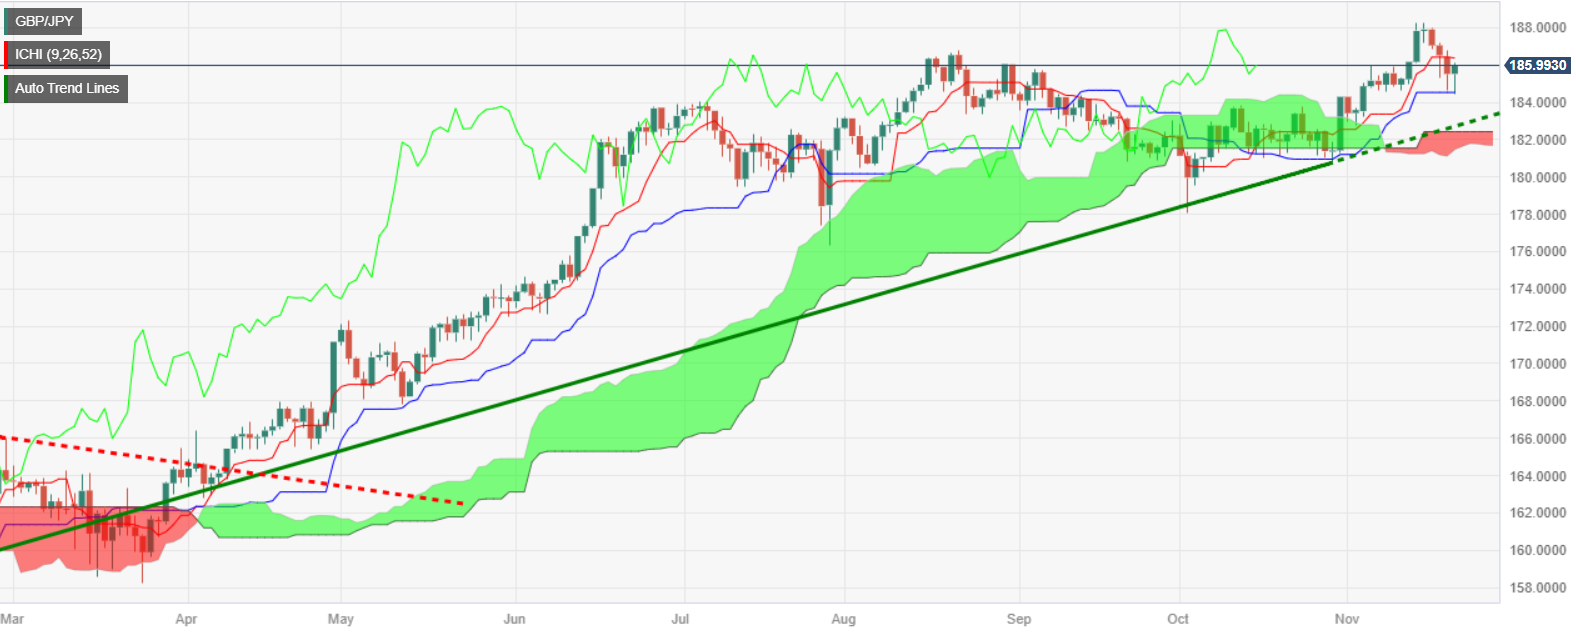
The GBP/JPY daily chart portrays the pair as neutral biased, as the slope of the Tenkan and Kijun-Sen shifted flat, which could open the door for range-bound trading. On the upside, the pair’s first resistance would be the Tenkan-Sen at 186.37, followed by the 187.00 figure, ahead of the year-to-date (YTD) high at 188.24.
On the other hand, if GBP/JPY drops below the Kijun-Sen at 184.52, that would pave the way to test the Senkou Span B at 183.15, followed by the bottom of the Ichimoku Cloud (Kumo) at 181.75.
GBP/JPY Price Analysis – Daily Chart
GBP/JPY Technical Levels