Gold Price Forecast: XAU/USD finds a cushion around $1,980, downside seems favored ahead of Fed policy
- Gold price is defending its downside around $1,980.00, downside bias is deepening ahead of Fed policy.
- US labor market conditions are expected to lose further as Morgan Stanley has announced 3K more job cuts.
- Gold price is consolidating in a Symmetrical Triangle in which volatility contracts ahead of a critical event.
Gold price (XAU/USD) is continuously defending downside around the crucial support of $1,980.00 for the past few weeks. The precious metal is prone to downside as the appeal for the US Dollar Index (DXY) is improving ahead of the interest rate decision by the Federal Reserve (Fed).
A consecutive 25 basis point (bp) interest rate hike is expected from Fed chair Jerome Powell to continue to weigh pressure on United States inflation. One more 25bp rate hike from the Fed is widely expected, however, the event that is infusing anxiety among the market participants is the interest rate guidance.
Considering recent events of declining growth rate as US Gross Domestic Product (GDP) slowed to 1.1% on a quarterly basis due to lower inventories, ISM Manufacturing PMI landed below 50.0 straight for the sixth month and a downward revision to Retail Sales indicate that the Fed would sound neutral on guidance.
Apart from that, US labor market conditions are expected to lose further as Morgan Stanley has announced a planned lay-off of 3K more jobs as deals have slumped as reported by Bloomberg.
Meanwhile, S&P500 settled Monday’s session with some losses as investors are turning cautious ahead of the interest rate policy by the Fed. The USD Index is gathering strength for breaking above the immediate resistance of 102.20.
Gold technical analysis
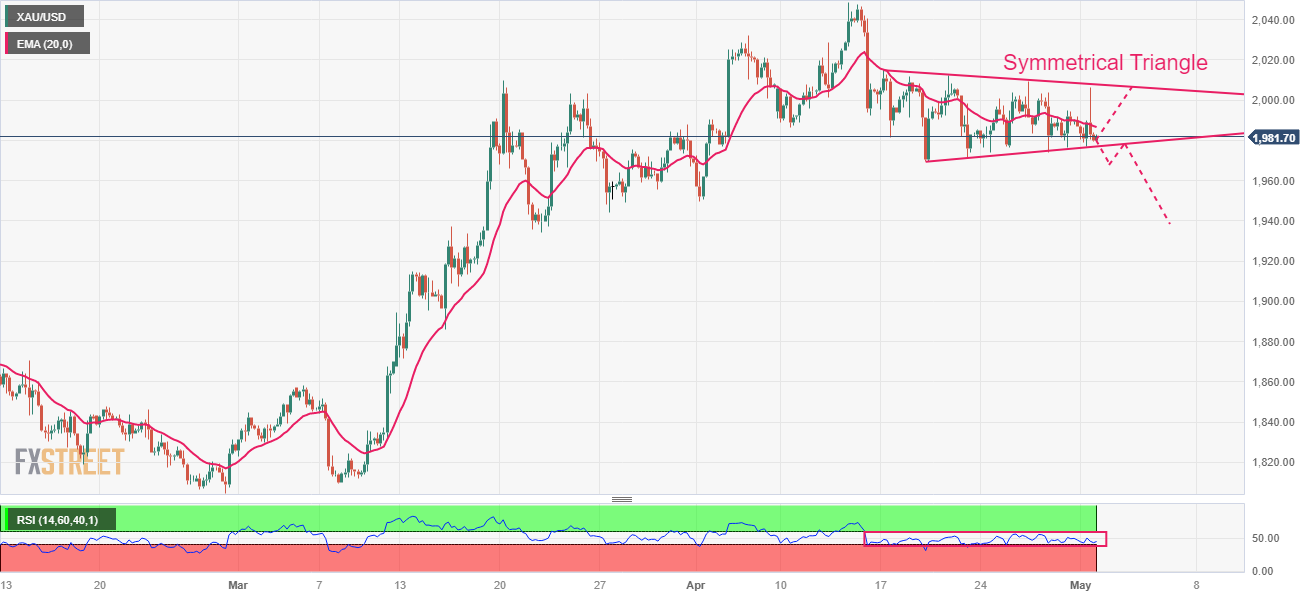
Gold price is consolidating in a Symmetrical Triangle chart pattern on a four-hour scale in which volatility contracts significantly ahead of a critical event. The upward-sloping trendline of the aforementioned pattern is plotted from April 19 low at $1,969.26 while the downward-sloping trendline is placed from April 17 high at $2,015.23.
The 20-period Exponential Moving Average (EMA) at $1,987.20 seems sticky to the Gold price, indicating a rangebound auction.
Also, the Relative Strength Index (RSI) (14) is hovering in the 40.00-60.00 range, which hints at a sheer consolidation.
Gold four-hour chart