Gold Price Forecast: XAU/USD bears eye $1,810 as higher Fed rate looms – Confluence Detector
- Gold price remains below the key $1,830 support confluence as hawkish Fed bets fuel US Dollar.
- Upbeat US Treasury bond yields, strong US data and risk-negative macros from China weigh on XAU/USD.
- Light calendar ahead of next week’s Fed Minutes keep Gold bears in the driver’s seat.
Gold price (XAU/USD) renews a six-week low as concerns surrounding the US Federal Reserve’s (Fed) higher interest rates propel the US Dollar. Adding strength to the greenback’s run-up, which ultimately weighs on the XAU/USD, are the upbeat US Treasury bond yields and challenges to the market sentiment, not to forget upbeat US data.
A slew of US statistics concerning inflation, employment and output have been positive of late, which in turn push back the Fed’s policy pivot talks. The same could be witnessed in the latest comments from the Fed officials and the FEDWATCH tool, observed via Reuters. The same joins the recent fears of more US-China tussles over the spy balloon and Taiwan to bolster the US Dollar’s safe-haven demand, which in turn allows the US Dollar Index (DXY) to renew a 1.5-month high and drown the Gold price.
Moving on, a light calendar and cautious mood, not to forget the multi-day high Treasury bond yields, can keep the XAU/USD buyers hopeful ahead of next week’s monetary policy meeting minutes of the Federal Open Market Committee (FOMC).
Also read: Gold Price Forecast: XAU/USD stays depressed as upbeat United States data propel US Dollar
Gold Price: Key levels to watch
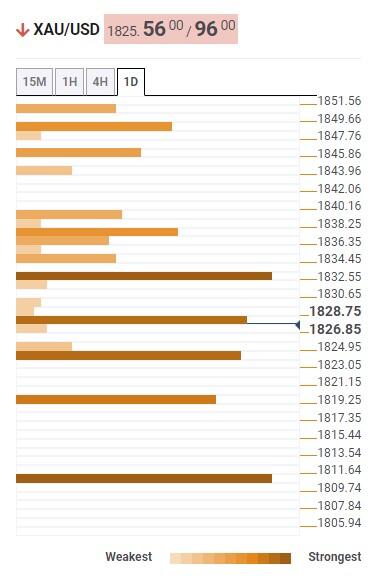
The Technical Confluence Detector shows that the Gold price has broken the key $1,830 support confluence comprising Pivot Point one week S1 and Fibonacci 23.6% on one day, which in turn opens the door for the metal’s further downside.
However, the road towards the south appears bumpy as XAU/USD flirts with the $1,825 support confluence by the press time, which encompasses the previous low on daily and Pivot Point one day S1.
Following that, the previous monthly low surrounding $1,822 may test the Gold bears before directing them to the $1,820 support including the Bollinger bank one day lower and Pivot Point one day S2.
It’s worth noting that the Pivot Point S3 on Daily and Weekly formations highlight $1,810 as the short-term key support for the Gold traders to watch during the metal’s further downside.
On the flip side, a successful run-up beyond $1,830 can aim for a 50-HMA level near $1,840 before emphasizing the $1,850 upside hurdle, including Pivot Point one week S1.
Here is how it looks on the tool
About Technical Confluences Detector
The TCD (Technical Confluences Detector) is a tool to locate and point out those price levels where there is a congestion of indicators, moving averages, Fibonacci levels, Pivot Points, etc. If you are a short-term trader, you will find entry points for counter-trend strategies and hunt a few points at a time. If you are a medium-to-long-term trader, this tool will allow you to know in advance the price levels where a medium-to-long-term trend may stop and rest, where to unwind positions, or where to increase your position size.